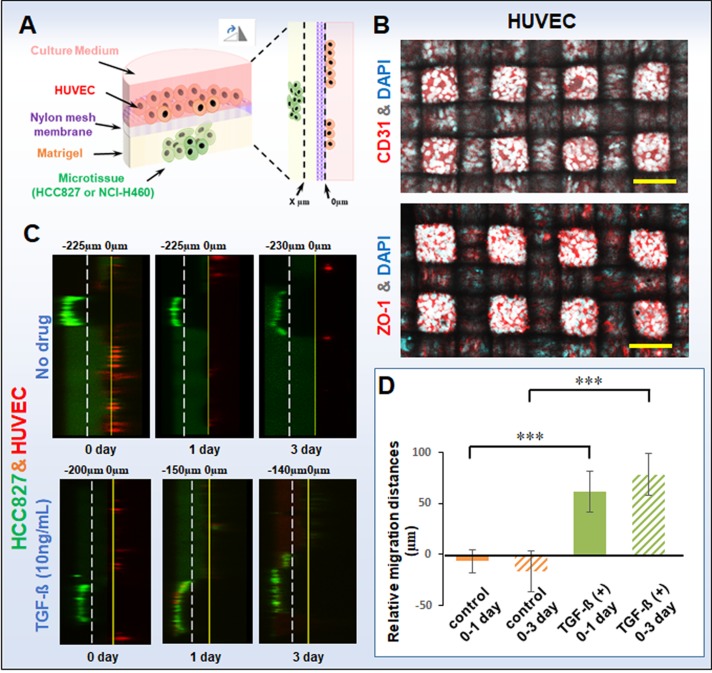
FIG. 5.
(a) Schematic of migration of tumor cell microtissues under cell co-culture in a well-mesh microchip. The HUVEC position was determined to be 0 μm, and the site of tumor microtissue near to the HUVEC was determined to be “x” μm. We observed the cell migration by “x” change on days 0, 1, and 3. (b) CD31 and ZO-1 expression of HUVECs. CD31 or ZO-1: red; cell nucleus DAPI: blue. (c) Migration images of HCC827 microtissue with or without TGF-β. HCC827: green; HUVEC: red; bar = 100 μm. A slice scan was performed by using a confocal microscope with a scan accuracy of 5 μm/slide. (d) Histogram of migration distances of HCC827 microtissue with or without TGF-β. The standard errors were obtained from Student's t-test. n = 3; ***P < 0.005; Microtissue without TGF-β refers to the control group.

