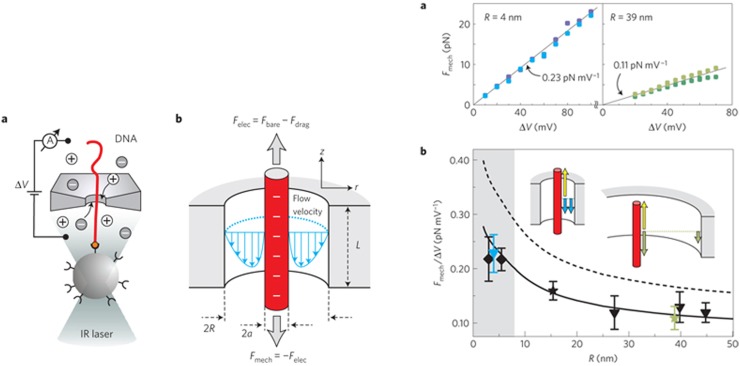
FIG. 9.
(Left panel) Schematic diagram of a “tethered DNA” experiment:118 DNA translocation is stalled by applying a pulling force on the DNA by attaching one end to a streptavidin coated polystyrene bead and holding the bead in a laser optical trap. Also shown is the flow field and balance of forces. (Right panel) Measured stall forces showing a linear dependence of the stall force on the voltage [Panel (a)] and the logarithmic dependence of the force per unit voltage on the pore radius [Panel (b)]. The symbols are measured values and the lines are theoretical results. Adapted with permission from van Dorp et al., Nat. Phys. 5(5), 347–351 (2009). Copyright 2009 Springer Nature.

