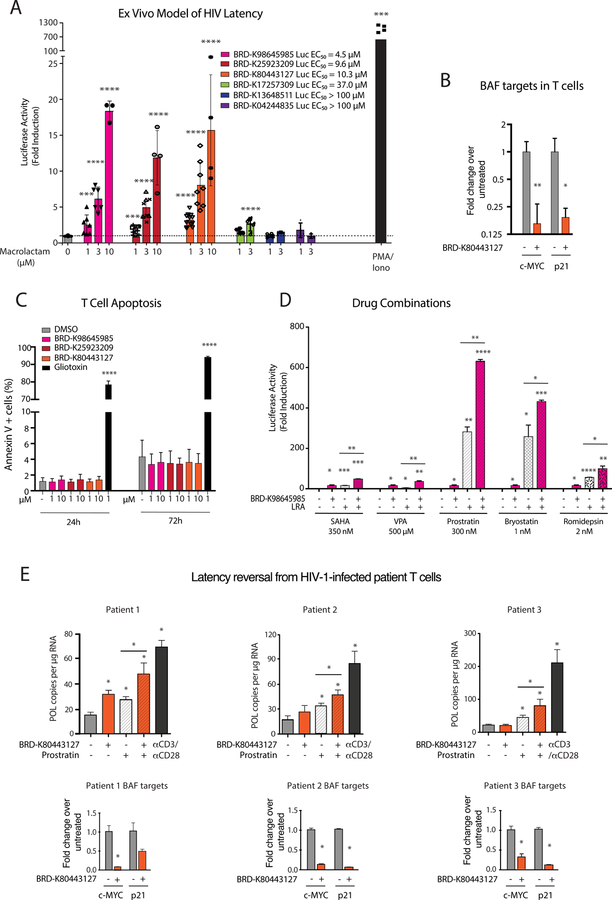
Figure 4: 12-membered macrolactams reactivate latent HIV-1 in primary model systems of HIV-1 latency and patient samples with limited toxicity or T-cell activation.
A. A panel of six macrolactams with varying EC50 values from the Bmi1-luciferase assay were tested in an ex vivo model of HIV-1 latency using primary CD4+ T cells from healthy donors (Lassen et al., 2012). Each point represents a single experiment using T cells from at least two different healthy donors. Luciferase levels are normalized with total protein levels. Error bars represent mean ± S.D. Asterisks indicate the level significance compared to untreated cells using student’s T test (* p< 0.05 ** p< 0.01, *** p< 0.001, **** p< 0.0001). B. mRNA expression levels of two BAF target genes were determined after treatment of CD4+ T cells isolated from 3 healthy donors with BRD-K80443127. Bars represent the average ± SD, Asterisks indicate the level significance compared to untreated cells using student’s T test (* p< 0.05 ** p< 0.01, *** p< 0.001, **** p< 0.0001). C. The number of apoptotic human primary CD4+ T cells in the presence of macrolactams was measured using Annexin V staining and flow cytometry analysis. Data presented as mean ± S.D. of experiments performed on cells isolated from 6 healthy donors. D. Latency reversal activity of BRD-K80443127 in combination with known LRAs was assessed in the ex-vivo model of HIV-1 latency. BRD-K80443127 was used at a concentration of 5 µM alone or in combination with known LRAs at a single dose. Luciferase levels are normalized with total protein levels. Data presented as mean ± S.D. of experiments performed in duplicate using cells from two healthy donors. Asterisks indicate the level significance compared to untreated cells using student’s T test (* p< 0.05 ** p< 0.01, *** p< 0.001, **** p< 0.0001). E. Cell associated HIV Pol mRNA levels were quantitated in CD4+ T cells obtained from three c-ART treated virologically suppressed HIV-1 infected patients after ex vivo treatment with BRD-K80443127 (10 µM), Prostratin (200 nM) or αCD3/αCD28 dynabeads as indicated in triplicate. Bars represent average of treatments in triplicate ± SD, asterisks indicate the level of significance using one-way ANOVA followed by Tukey test (p< 0.05). mRNA expression levels of biomarker genes of BAF activity, c-MYC and p-21 were also quantitated in the patient CD4+ T cells after treatment with DMSO or BRD-K80443127 (10 µM). See also Figure S4.

