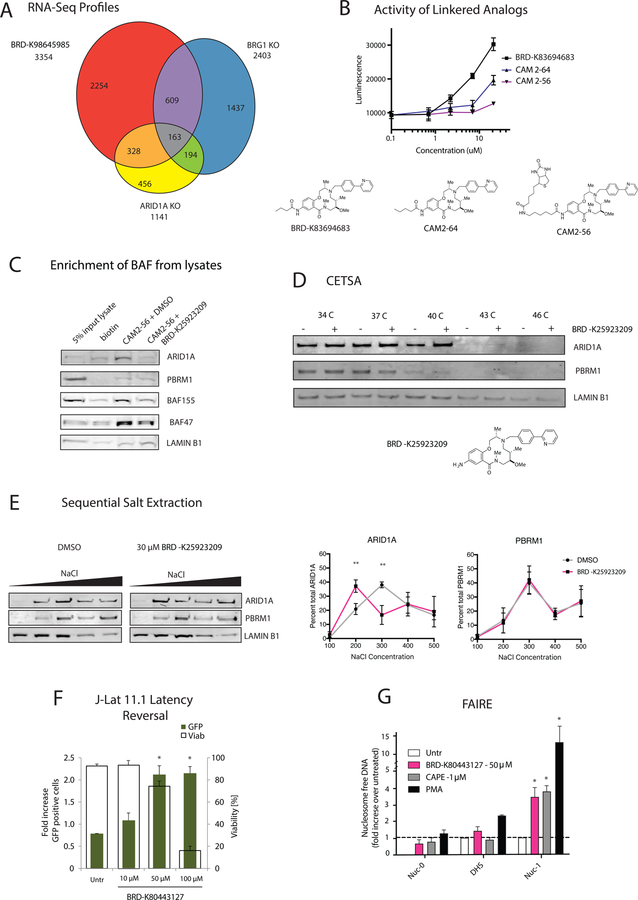
Figure 5: 12-membered Macrolactams are inhibitors of ARID1A-containing BAF complexes.
A. Differential gene expression of mESCs treated with 30 µM of BRD-K98645985 for 18 h was compared to published differential gene expression in Brg1 KO mESCs (King and Klose, 2017) to determine overlapping gene sets. Data was acquired from RNA-Seq analyses. B. The luciferase induction upon treatment with macrolactams with propyl amide (BRD-K83694683), butyl amide (CAM2–64) and biotin-hexylamide (CAM2–56) appended off the aniline was determined using the BMI1-luciferase reporter cell line. C. Pulldowns were performed from ESC lysates pretreated with DMSO or 200 µM BRD- K25923209 using biotin or CAM2–56 prebound to streptavidin resin. Protein enrichment was determined using immunoblot analysis. D. Protein stabilization by BRD-K25923209 was determined using CETSA in mESCs. The stabilization of ARID1A, PBRM1 and LAMINB1 was detected using immunoblot analysis of soluble proteins after incubation in a temperature gradient. E. Sequential salt extractions were performed on ESC nuclei. The chromatin was washed with increasing concentrations of salt containing DMSO or BRD-K98645985 (30 µM) and the elution of ARID1A and PBRM1 were analyzed using immunoblot analysis. The percent of protein elution was calculated across all five washes using ImageJ for ARID1A and PBRM1. n = 3. F. J-Lat 11.1 cells were treated with increasing concentrations of BRD-K80443127 and reactivation was quantitated at 48 h post treatment. Percent GFP positive cells (left axis, green bars), which corresponds to the level of HIV-1 activation, and cell viability (right axis, transparent bars) were both evaluated by flow cytometry. n = 3. G. Levels of nucleosome occupancy at the HIV-1 5’-LTR region following treatment with BRD-K80443127, CAPE, and PMA were analyzed using FAIRE assay. n = 3. Data are presented as mean ± S.D. Asterisks indicate the level significance compared to untreated cells using student’s T test (* p< 0.05 ** p< 0.01, *** p< 0.001, **** p< 0.0001). See also Figure S5.

