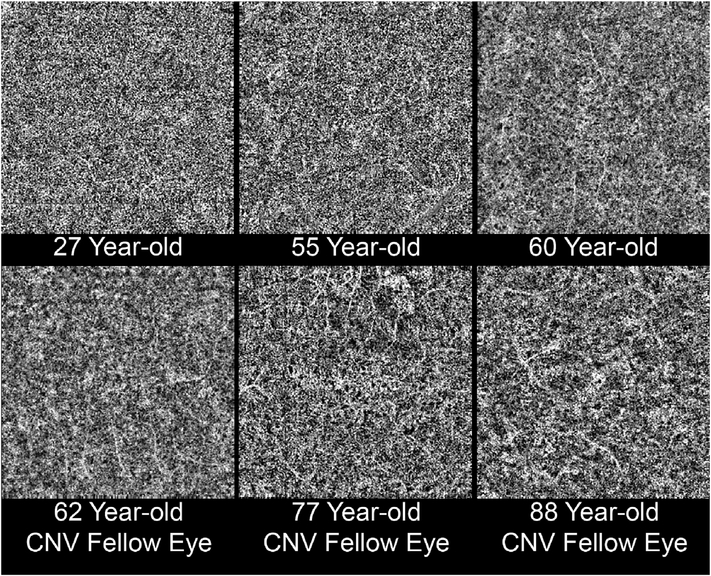
Fig. 32.
Choriocapillaris images from subjects of varying ages obtained using optical coherence tomography angiography of the central macula. Each image represents an area of 3000 × 3000 μm. The bright areas correspond to high flow signal while the dark regions are called flow voids and represent areas where there is a lack of flow signal. The age range is from 27 years (upper left) to 88 years (lower right). The bottom row of images shows not only those of increasing age, but also with choroidal neovascularization in the fellow eye. Reprinted from Spaide (2016a).

