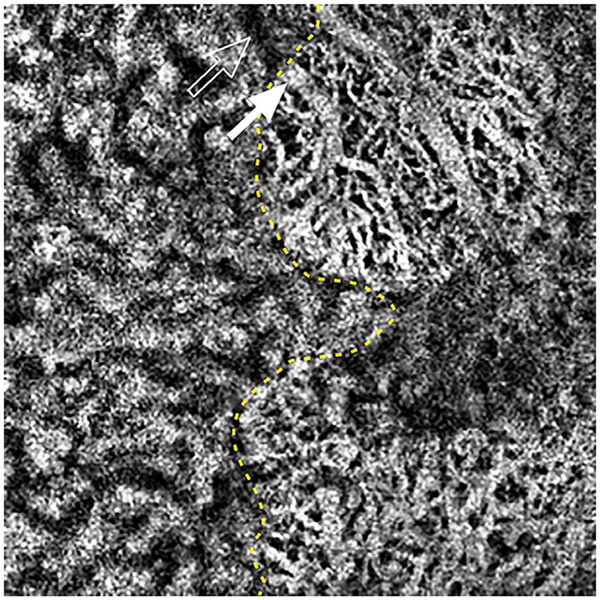
Fig. 36.
An OCTA image of the submacular choroid obtained in a patient with geographic atrophy. There is atrophy to the right of the dashed yellow line. The larger choroidal vessels show visible flow signal while they do not in the areas with extant retinal pigment epithelium. Note the course of one large choroidal vessel from an area under the RPE (open arrow) to the area of atrophy (white arrow.).

