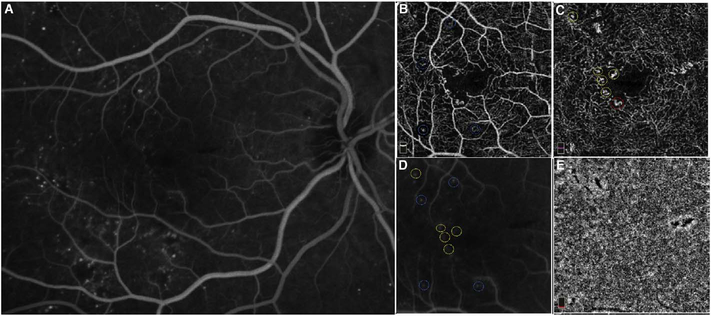
Fig. 38.
Fluorescein angiography (FA) of a diabetic eye (A) and the corresponding OCTA image segmented at the superficial retinal capillary plexus (B) and the deep capillary plexus (C). Note the microvascular changes seen on the OCTA including microaneurysms, vascular dropout and a ragged appearance of the foveal avascular zone. Figure D is the FA cropped to a 3 × 3mm size to correspond to the OCTA image. Blue circles show microaneurysms visualized better on the superficial capillary layer of the OCTA and yellow circles show some examples of microaneurysms visualized better on the deep retinal capillary layer of the OCTA. The red circle demonstrates a microvascular abnormality that spans both the superficial and the deep plexi. Note that there are some microaneurysms that are seen on the FA but not seen on the OCTA. Figure E is a corresponding image of the choriocapillaris showing areas of choriocapillaris dropout.

