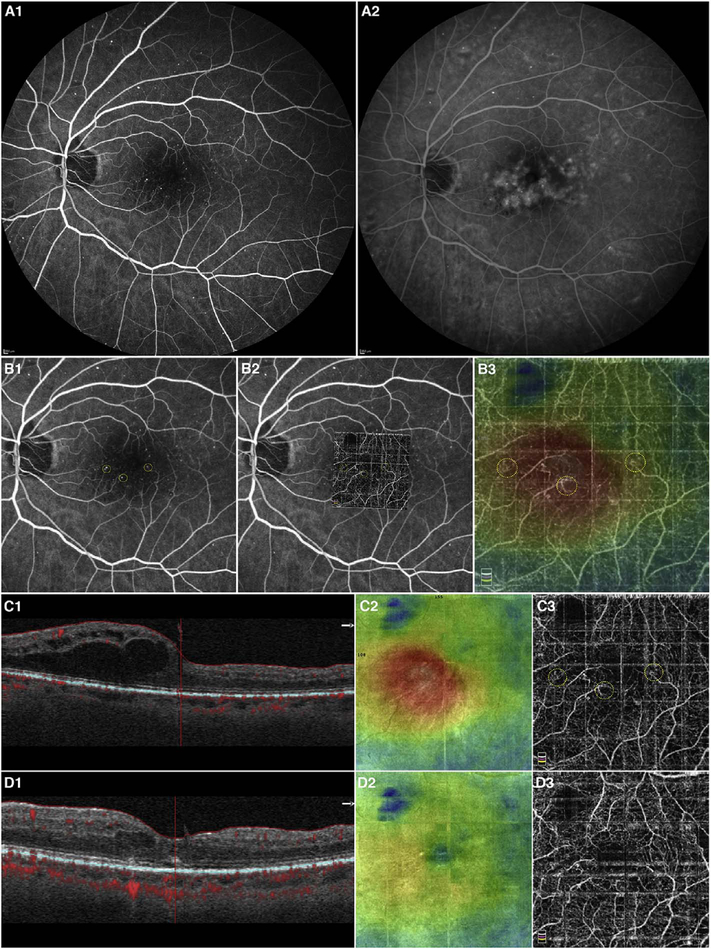
Fig. 42.
Images of a patient with diabetic macular edema. (A) FA early frame (A1) and late frame (A2) showing that some microaneurysms are leaking while others are not. This is somewhat difficult to identify because of previous focal laser. B1 is a magnified FA image. The 3 mm × 3 mm OCT angiogram is overlaid on the FA image (B2) to show which microaneurysms on the OCT angiogram correspond to those on the FA. Note that not all microaneurysms seen on the FA are seen on the OCTA. (B3) The OCT thickness map is superimposed over the OCTA image to show that there is thickening due to leakage at and around some microaneurysms, while the non-leaking microaneurysms do not show any fluid accumulation. (C1-C3) OCT b-scan, OCT thickness map and OCTA image from the same patient visit in A-B showing edema. (D1–3) OCT b-scan, thickness map and OCTA from the same patient in A-B after intravitreal injections of anti-vascular endothelial growth factor agents. The edema has improved.

