Fig. 5.
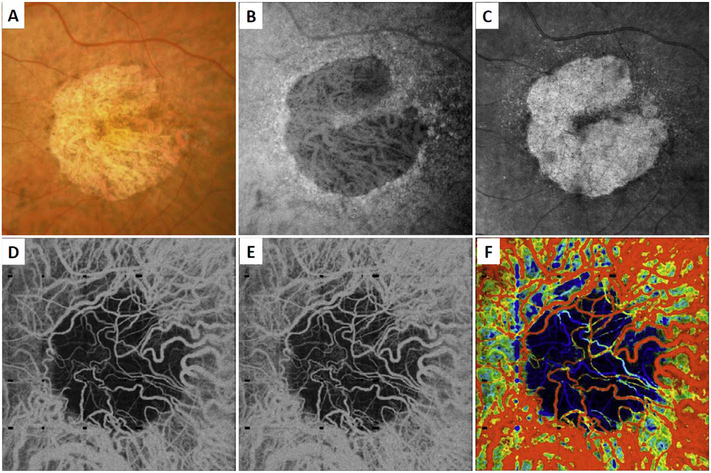
Variable interscan time analysis (VISTA) visualization. Example of VISTA visualization of choriocapillaris flow impairment in a 75-year-old GA patient. SS-OCT and OCTA acquired with 400,000 A-scans per second with 6 mm × 6 mm field of view. (A) Fundus photo cropped to OCT field of view. (B) Fundus autofluorescence. (C) OCT en face image, mean projection. (D) OCTA en face image with 1.5 ms interscan time, mean projection through ∼90 μm slab below Bruch’s membrane. (E) OCTA with 3.0 ms interscan time, mean projection through ∼90 μm slab below Bruch’s membrane. Comparing the 3.0 ms–1.5 ms interscan time images shows regions of choriocapillaris flow impairment. (F) VISTA image with red vs blue false color indicate faster vs slow erythrocyte speed. The left margin of the GA exhibits a region of flow impairment (From Ploner et al. Retina, 2016).

