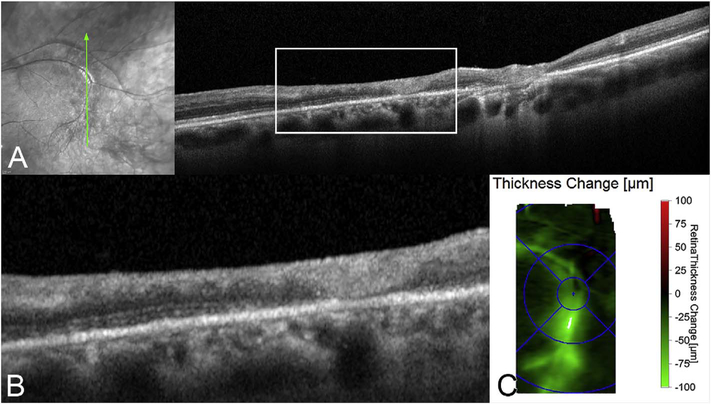
Fig. 67.
One month after intravitreal triamcinolone. (A) Left panel shows the location of the scan, which is the same as Fig. 65 B and D. The right panel shows continued retinal thinning. (B) Enlarged depiction of the area enclosed by the rectangle in (B). (C) A heat map of the change in retinal thickness from prior to intravitreal triamcinolone. The area of retinal thinning as shown by the heat map is similar to the region of fluorescein leakage and staining seen in Fig. 64 B. Reprinted from Spaide (2017c).

