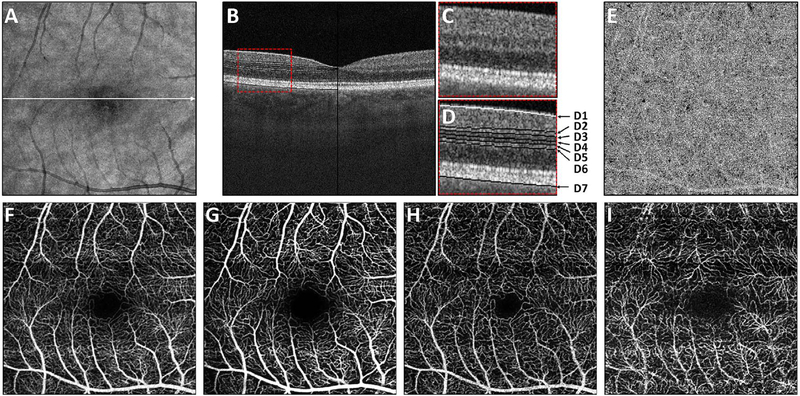
Fig. 7.
How retinal capillary plexus and choriocapillaris images are generated. Vascular layers can be independently displayed by segmenting retinal architecture in OCT structural images and projecting the OCTA over axial depth ranges in order to generate en face images. (A) En face OCT image. (B) OCT B-scan through the macula with enlargement (C) showing retinal layers. (D) Retinal layers showing segmentation contours; D1 indicates the ILM; D2 indicates contour C3 offset by half the INL width; D3 indicates the IPL-INL boundary; D4 indicates the midline between contours D3 and D5; D5 indicates the INL-OPL boundary; D6 indicates contour D5 offset by half the INL width; contour D7 indicates the Bruch’s membrane. (E) En face OCTA of the choriocapillaris was generated by projecting a thin slab below Bruch’s membrane D7. (F) En face OCTA of the total retinal vasculature, projecting from the ILM to the RPE (contour not shown). En face OCTA images of different capillary plexuses generated by summing over depth ranges. OCTA of the surficial (G), intermediate (H) and deep plexus (I) were generated by projecting between contours D1 to D2, D2 to D4, and D4 to D6 respectively. (Adapted from Choi et al. Retina, 2017).

