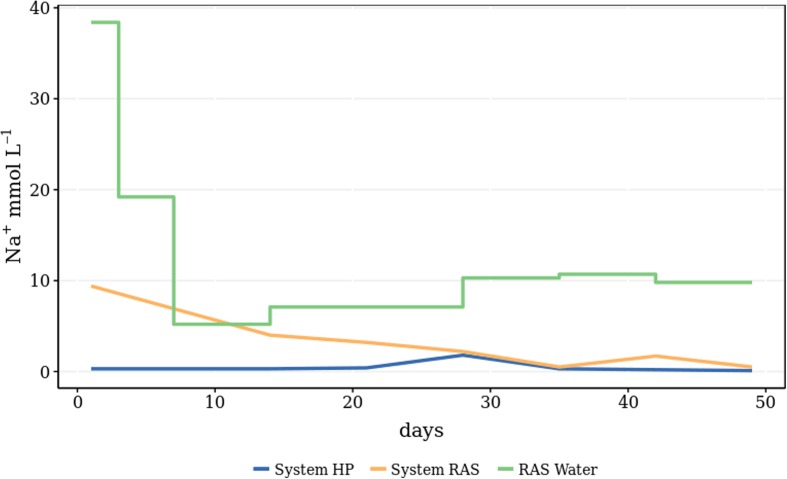
Fig. 5.
Sodium concentration in both RAS and HP systems (yellow and blue line respectively) as well as the sodium concentration of the RAS water (green line) that was added to the RAS system on a weekly basis. System RAS was first prepared with RAS water of higher sodium concentration (data not shown)

