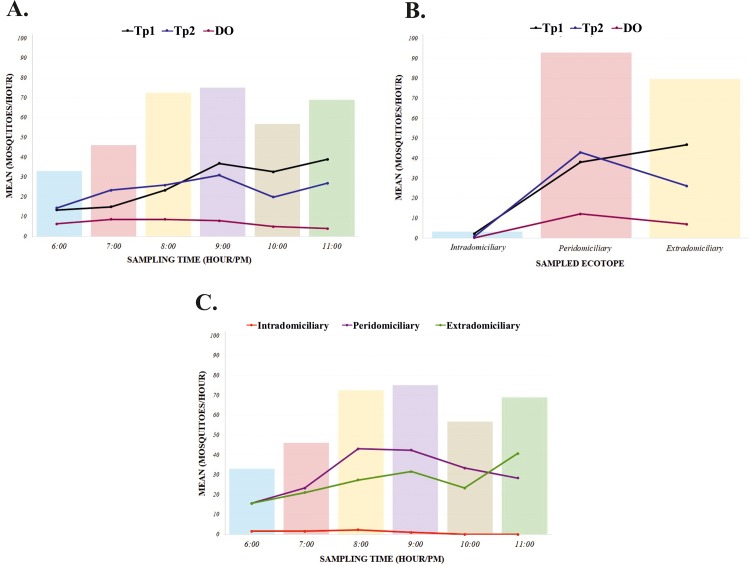
Fig 2. Mosquito abundance according to community, sampling time and ecotope.
A) The mean number of mosquitoes according to sampling time and area sampled; the bars show the mean number of mosquitoes according to sampling time and continuous lines show the mean for mosquitoes per community evaluated (Tp1: Tipisca first sampling; Tp2: Tipisca second sampling; DO: Doce de Octubre). B) The mean number of mosquitoes according to ecotope and community; the bars show the mean for the number of mosquitoes according to ecotope and continuous lines show the mean for mosquitoes per ecotope and community evaluated (Tp1, Tp2 and DO). C) The mean number of mosquitoes according to ecotope and sampling time; the bars show the mean number of mosquitoes according to sampling time and continuous lines show the mean of mosquitoes per ecotope.

