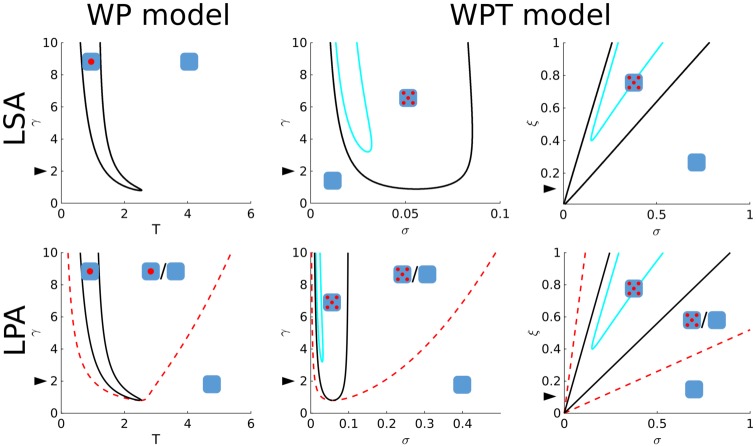
Fig 4. Two parameter bifurcation plots for models with two variables (WP and WPT).
Both LSA (top) and LPA (bottom) analyses were performed on the WP model for parameters T and γ (left) and on the WPT model for parameters σ and γ, and σ and ξ (right). Cartoons indicate kind of pattern formed in different regimes (empty square: no pattern, single spot: polarisation, five spots: coexistence). Black lines delimit Turing regimes in which the homogeneous steady state is unstable. Dashed red lines (LPA only) delimit predictions of regimes in which heterogeneous states exist that may be reached from the homogeneous state by an arbitrarily large local perturbation. Cyan lines indicate Hopf regimes. Arrowheads indicate default parameters.

