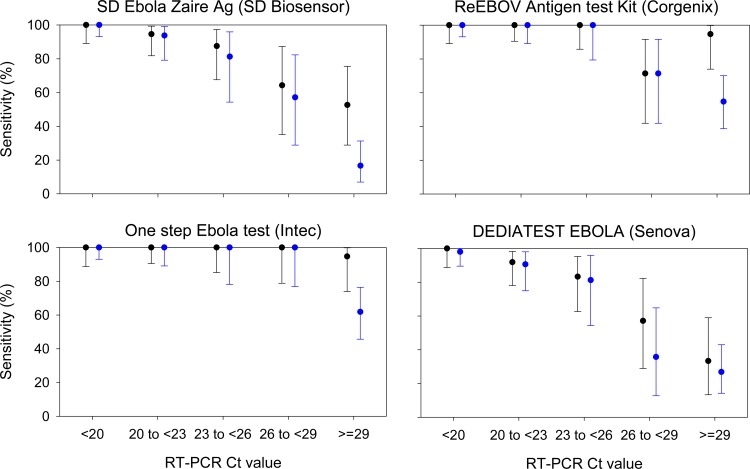
Fig 2. Sensitivity of LFIs for samples grouped according to altona Ct value (black) and Trombley Ct value (blue).
Bars represent 95% confidence intervals for sensitivity. For the altona assay there were 32, 37, 24, 14 and 19 samples in each RT-PCR Ct group from <20 to ≥29. The corresponding sample sizes for the Trombley assay were 52, 32, 16, 14 and 42.

