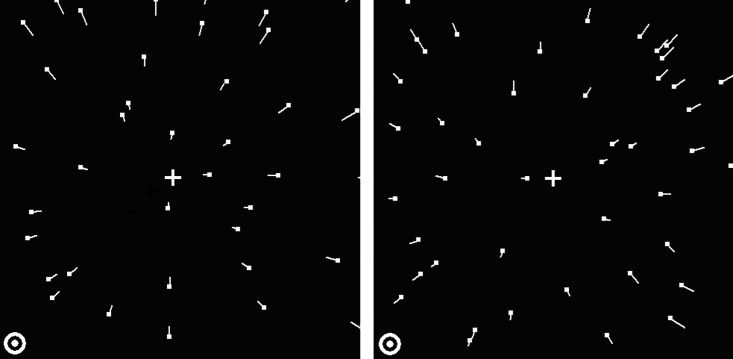
Fig 1. Schematic representations of a contracting (left panel) and an expanding (right panel) optic flow pattern in Experiment 1.
In this example, both optic flow patterns were presented in the upper right visual quadrant. In the other three conditions, both flow patterns were presented in one of the other three quadrants. Short white lines (not present in the experimental displays) show the direction of the trajectories of the moving dots (dots are shown at the start of their trajectory). The white cross in each panel (not present in the experimental display) denotes the veridical centres of the flow patterns. The circle in the lower left corner of each panel denotes the fixation point.

