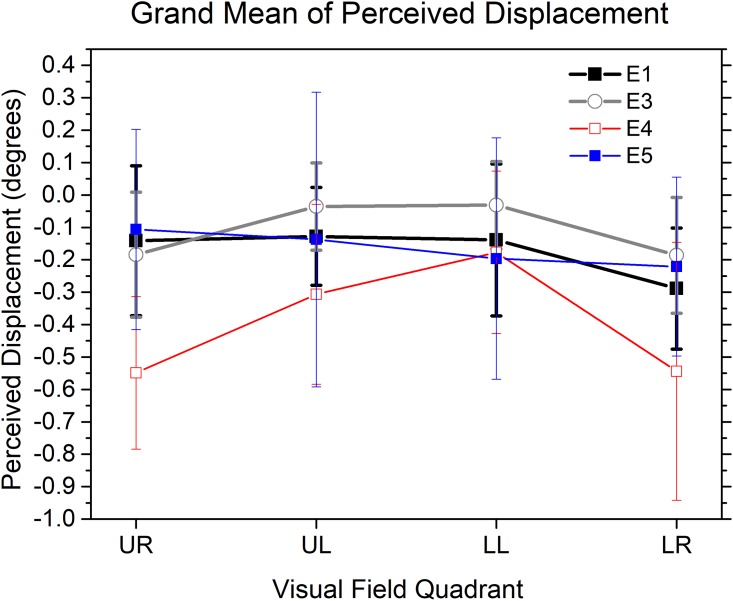
Fig 2. Mean perceived displacements between the centres of two optic flow patterns in each visual quadrant in Experiment 1, 3, 4 & 5.
UR: upper right; UL: upper left; LL: lower left; LR: lower right. Experiment 1: E1, black curve. Experiment 3: E3, gray curve. Experiment 4: E4, red curve. Experiment 5: E5, blue curve. Negative values of the y-axis show that the FOE of an expanding flow pattern is perceived as closer to the fixation point than the physically aligned FOC of a contracting flow pattern. Vertical bars represent 95% confidence intervals.

