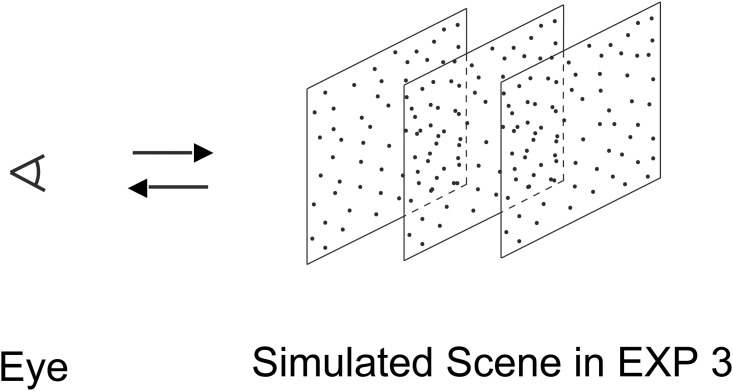
Fig 6. Schematic representation of the simulated scene in Experiment 3, which mimicked the effects of an observer’s motion towards or away from three transparent frontoparallel surfaces covered with random dots.
Experiments 1, 2, 4 & 5 mimicked an observer’s smooth motion towards or away from a single frontoparallel surface. The single frontoparallel surface was located at a distance from the observer’s eye equal to the middle surface in this figure for Experiments 1, 2 & 5 and equal to the left surface in this figure for Experiment 4, respectively. The average dot density on the single frontoparallel surface was three times of and equal to that on a surface in this figure for Experiments 1, 2 & 4 and Experiment 5, respectively.

