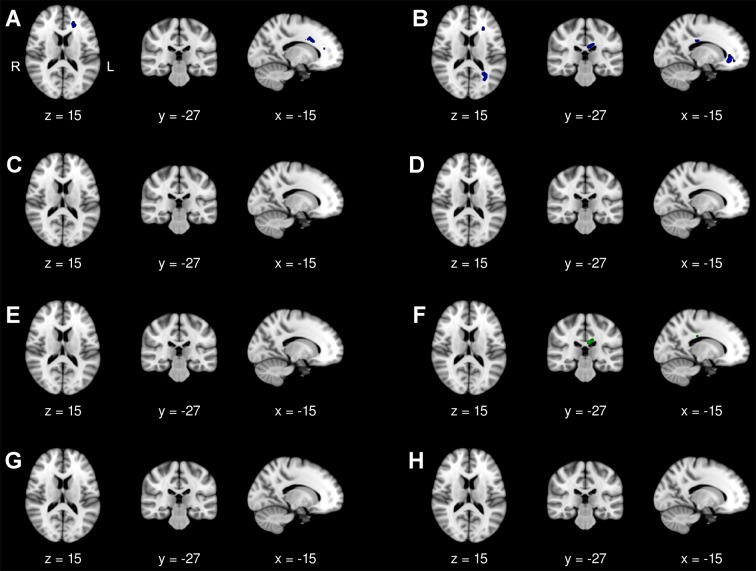
Fig 4. DM2 patients versus controls.
Diffusion tensor imaging group comparison at baseline and follow-up. Displayed results of tract-based spatial statistics analyses of different diffusivity indices (FA, AD, RD, MD) are based on a corrected threshold of pfamily wise error < 0.05 and overlaid on the MNI152 Template (resolution 1x1x1 mm) included in FSL. The coordinates refer to the MNI reference space. DTI analyses were performed in 16 DM2 patients and 14 controls. (A) FA reduction in DM2 patients compared with controls at baseline and (B) follow-up. (C) No increase in AD in DM2 patients compared with controls at baseline (no significant voxels detected) and (D) follow-up (no significant voxels detected). (E) No increase in RD in DM2 patients compared with controls at baseline (no significant voxels detected), but at (F) follow-up. (G) No increase of MD in DM2 patients compared with controls at baseline (no significant voxels detected) and (H) follow-up (no significant voxels detected).

