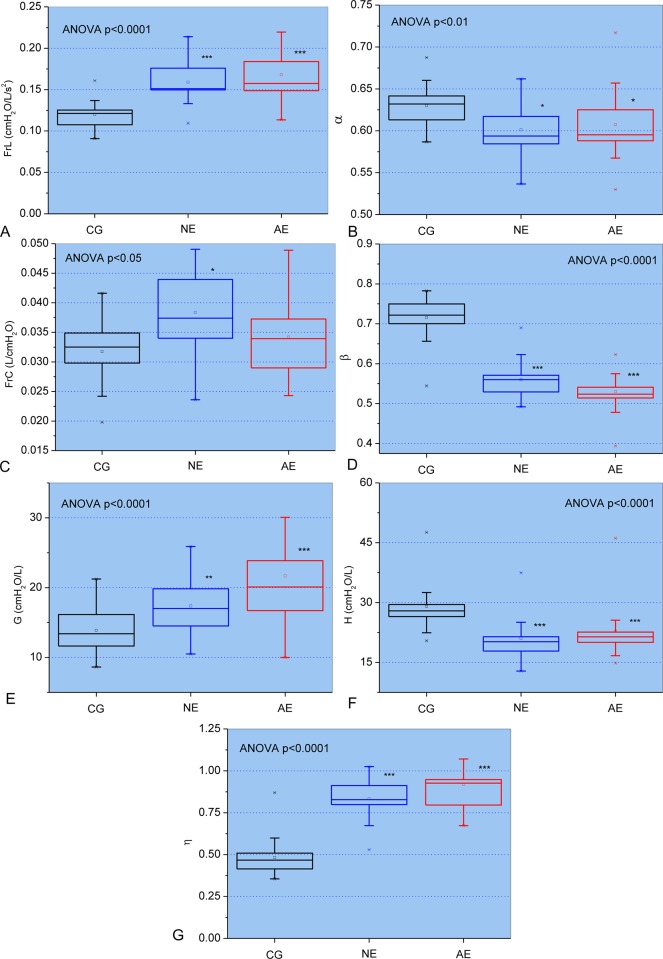
Fig 1.
Changes of the parameters obtained from the fractional-order model in the control group and patients with normal (NE) and abnormal (AE) spirometry: Fractional inertance (FrL; A) and associated fractional-order angle (α; B), the fractional compliance (FrC; C) and associated fractional-order angle (β; D), respiratory damping (G; E), elastance (H; F) and hysteresivity (η; G). The top and the bottom of the box plot represent the 25th- to 75th-percentile values while the circle represents the mean value, and the bar across the box represents the 50th-percentile value. The whiskers outside the box represent the 10th-to 90th-percentile values. *p<0.05, **p<0.01 and ***p<0.001 related to the control group.

