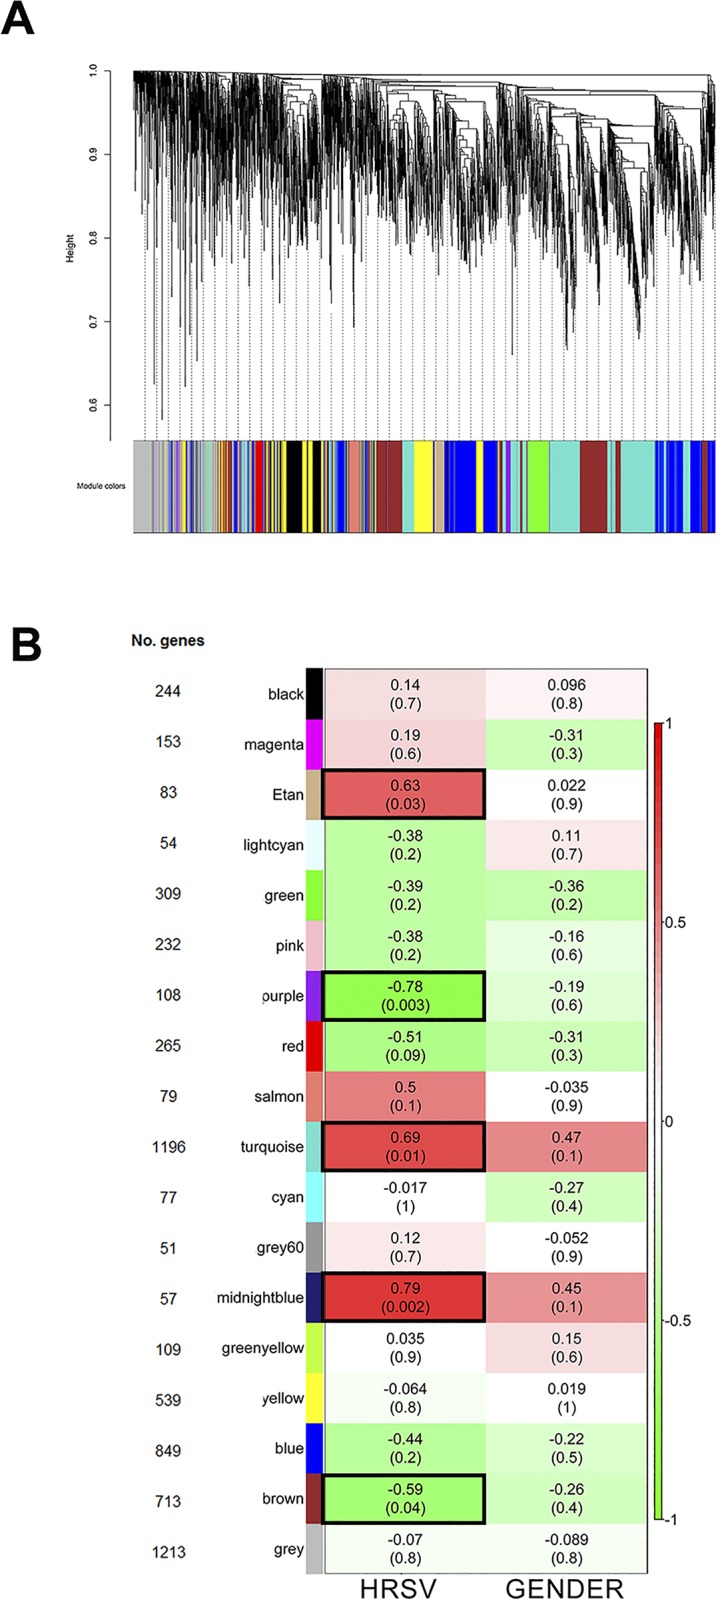
Fig 2. WGCNA dendrogram and modules correlation with HRSV group and gender.

A- Hierarchical clustering dendrogram and module identification, indicated by different colors; B- Heatmap of the relationship between modules (MEs) and traits (infection and gender). Only the HRSV group is shown. Numbers inside each colored box are the correlation coefficients between the ME and the specific trait, with p-value between brackets. The same values are true for the HRV group, but with an opposite correlation coefficient signal. The more intense the color of the box, the more negatively (green) or positively (red) correlated is the module with the trait. Five modules presented significant association (p<0.05) with the HRSV group and these modules are indicated by black borders.
