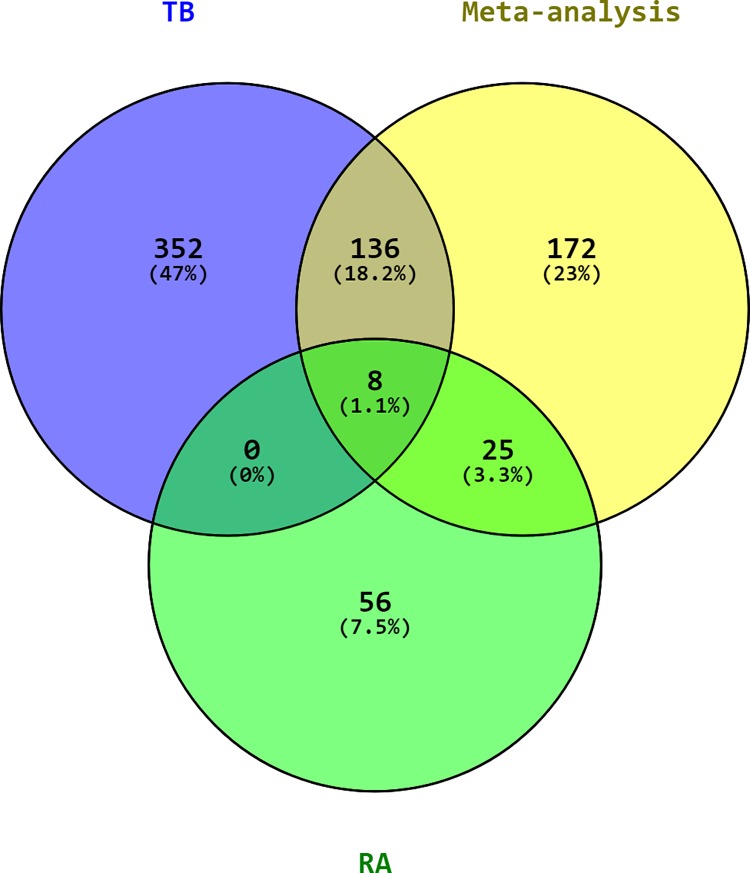
Fig 1. Venn diagram of DEGs.
In comparison to the individual meta-analysis of the Tuberculosis (TB) and rheumatoid arthritis (RA) datasets, the combined meta-analysis of both diseases shows many DEGs (172) that only were significantly different following this approach. Loss of genes that were only significant in their respective disease datasets (genes that play no role common to both conditions) is also expected. Data sets were analyzed with the same parameters in NetworkAnalyst, and genes with a p-value < 0.01 were considered significant.

