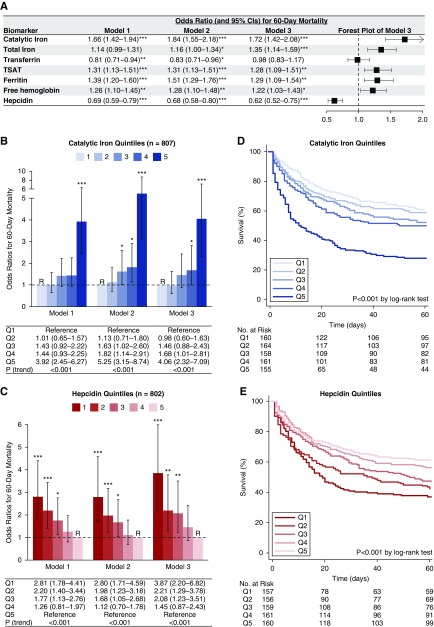
Figure 1.
Higher catalytic iron and lower hepcidin concentrations associate with death. Odds ratios (ORs; and 95% confidence intervals [95% CIs]) for death according to iron marker concentrations. A shows ORs for 60-day mortality according to natural log-transformed iron parameters standardized to 1 SD. Model 1 is unadjusted, model 2 is adjusted for demographics and comorbidities (age, sex, race, baseline eGFR, diabetes mellitus, congestive heart failure, chronic liver disease, and chronic lung disease), and model 3 is further adjusted for severity of illness (intensive care unit type; mechanical ventilation; Acute Physiology and Chronic Health Evaluation II score; RRT before randomization; treatment randomization group; oliguria; sepsis; shock; and serum/plasma levels of albumin, creatinine, and IL-6). For the analyses shown in A, only P values <0.01 are considered significant to account for multiple comparisons. TSAT, transferrin saturation. B shows ORs for 60-day mortality according to quintiles of catalytic iron. Quintile 1 was the reference (R) group in all models. Catalytic iron levels by quintile: quintile 1, 0.18–0.33 μmol/L; quintile 2, 0.34–0.46 μmol/L; quintile 3, 0.47–0.80 μmol/L; quintile 4, 0.81–2.12 μmol/L; and quintile 5, 2.16–47.01 μmol/L. C shows ORs for 60-day mortality according to quintiles of hepcidin (the y axis is cut at six). Quintile 5 was the reference (R) group in all models. Hepcidin levels by quintile: quintile 1, 4–33 ng/ml; quintile 2, 33–86 ng/ml; quintile 3, 86–163 ng/ml; quintile 4, 163–266 ng/ml; and quintile 5, 266–2415 ng/ml. *P<0.05; **P<0.01; ***P<0.001. D and E show Kaplan–Meier survival curves according to quintiles of catalytic iron and hepcidin, respectively.

