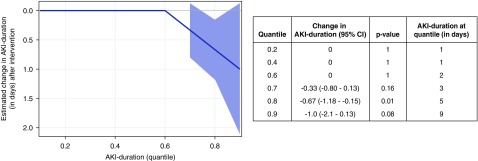
Figure 3.
Reduction in AKI duration in the intervention period, as shown by quantile regression analysis. AKI duration is shown on the y axis at different quantiles of the distribution. The solid line represents the estimated changes in AKI duration distribution quantiles from before to after the introduction of the intervention across the different quantiles of the distribution after adjustment for time, age, sex, comorbid conditions, cluster (hospital), and seasonality, and the shaded area represents the 95% confidence interval (95% CI). Results show a reduced AKI duration during the intervention period (from quantiles 0.8 onward; effect size and median AKI duration at individual quantiles are shown in the table).

