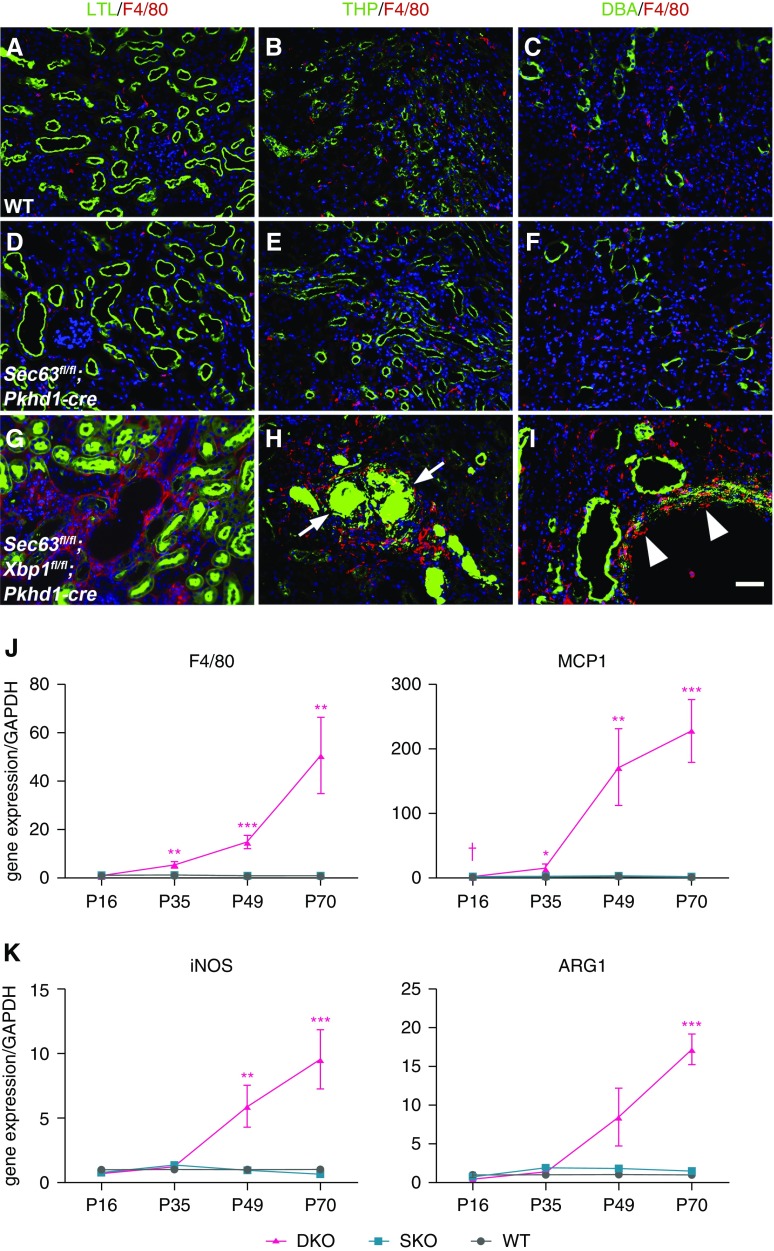
Figure 2.
Macrophage infiltrates in kidneys with dual inactivation of Sec63 and Xbp1. (A–I) Immunocytochemical analysis of (A–C) WT, (D–F) SKO, and (G–I) DKO kidneys at P35. (A, D, and G) show macrophages (F4/80; red) and proximal tubules (LTL; green); (B, E, and H) macrophages (red) and thick ascending limbs of the loop of Henle (Tamm–Horsfall protein [THP]; green); and (C, F, and I) macrophages (red) and collecting duct (Dolichos biflorus agglutinin [DBA]; green) in the outer medulla. (G–I) The macrophage infiltrates are much more prominent in DKO kidneys. (H) The inflamed DKO mTAL contains urinary THP casts (arrows). (I) Macrophages are found infiltrating around the collecting duct tubules (“tubulitis”; arrowheads). Nuclei are labeled with Hoechst, blue. Scale bar, 50 µm. (J) Gene transcript expression by quantitative RT-PCR for F4/80 and monocyte chemoattractant protein 1 (MCP1) indicates significantly increased mRNA levels in DKO kidneys compared with WT and SKO beginning at P35 (F4/80, n=3 and MCP1, n=6 at each time point for each genotype). Results are shown as mean ± SEM (ANOVA). ***P<0.001; **P<0.01; *P<0.05. (K) mRNA expression of iNOS is significantly increased in DKO at P49 and P70. Gene expression of Arg1 begins to increase at P49 and is significantly increased at P70. n=3 for each time point; results are shown as mean ± SEM (ANOVA). ***P<0.001; **P<0.01 compared with both WT and SKO.

