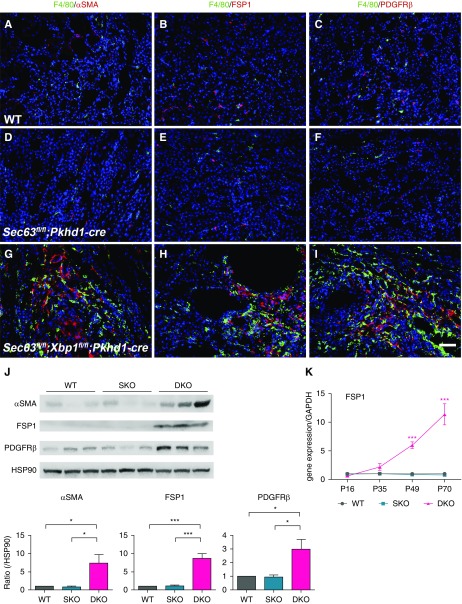
Figure 3.
Myofibroblasts coexist with macrophages in the kidneys of mice of double inactivation with Sec63 and Xbp1. (A–I) Immunocytochemical analysis of F4/80 (green) and (A, D, and G) α-smooth muscle actin (αSMA; red), (B, E, and H) FSP1 (red), and (C, F, and I) PDGFRβ (red) in kidneys with the indicated genotypes at P49. (G) αSMA-positive, (H) FSP1-positive, and (I) PDGFRβ-positive fibroblasts coexist with macrophages in DKO kidneys. Nuclei are labeled with Hoechst, blue. Scale bar, 50 µm. (J) Representative immunoblots (top) and aggregate densitometric quantification from kidney lysates (bottom) show that levels of αSMA, FSP1, and PDGFRβ are significantly increased in DKO compared with WT and SKO kidneys at P49. Densitometry is normalized to HSP90, which serves as loading control. n=3 per genotype; results are shown as mean ± SEM (ANOVA). ***P<0.001; *P<0.05. (K) Time course for mRNA expression level by quantitative RT-PCR of FSP1 shows significantly increased levels of transcripts in DKO kidneys at P49 and P70. n=3 at each time point for each genotype; results are shown as mean ± SEM (ANOVA). ***P<0.001.

