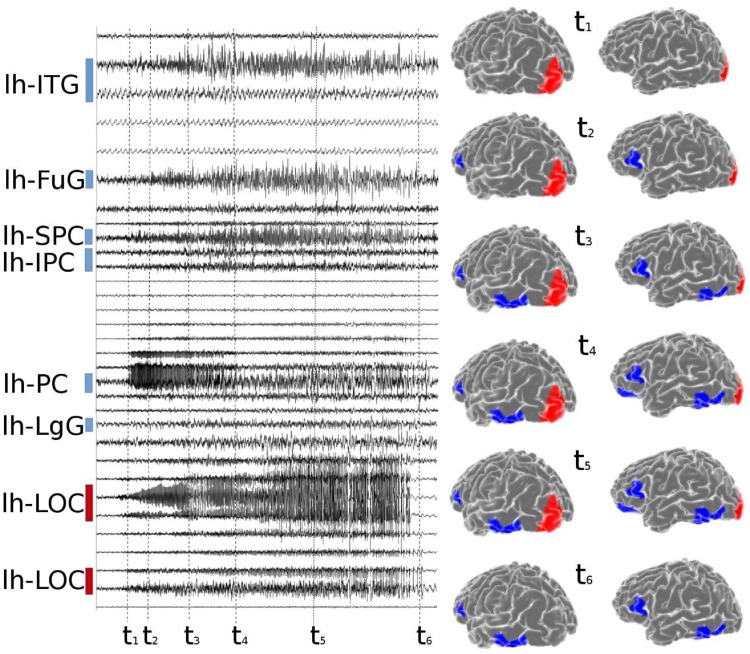
Fig 1. Stereotactic Electroencephalographic (SEEG) data of patient CJ.
Left panel: time series of partial seizures recorded with SEEG. The colored bars indicate the EZ (red)and PZ (blue). Right panel: On the top, the spatial organization of the EZ and PZ is shown on the left hemisphere, frontal-lateral and lateral view. Below, spatiotemporal activation patterns are plotted at different time points of the seizures. The same time points highlighted with black dashed lines in the left panel. lh-SPC, left superior parietal cortex; lh-IPC, left inferior parietal cortex; lh-LgG, left lingual gyrus; lh-LOC, left lateral occipital cortex; lh-FuG, left fusiform gyrus; lh-PC, left Pericalcarine; lh-ITG, left inferior temporal gyrus.

