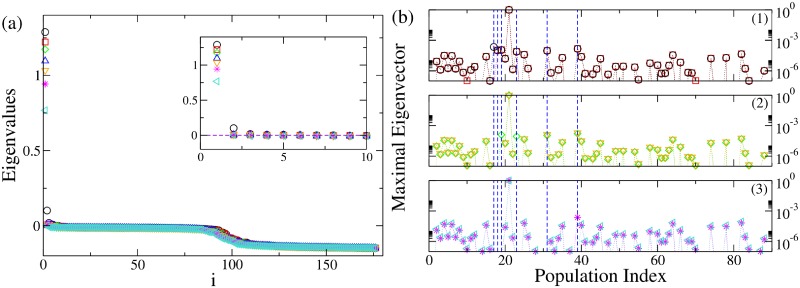
Fig 5. Analysis of patient CJ.
Panel (a): Eigenvalues of the system when the original structural connectivity is considered as a network structure (black circles). The index i on the x-axis represents the eigenvalues index (for more details see SI). Red squares represent the eigenvalues of the networks when the link between the populations (nodes) LOC-FuG (21-17) is removed. Green diamonds represent the eigenvalues of the networks when the links between the populations (nodes) LOC-FuG, LOC-SPC (21-17, 21-39) are removed. Blue triangles represent the eigenvalues of the networks when 3 connections between the regions (nodes) LOC-FuG, LOC-SPC, LOC-ITG (21-17, 21-39, 21-19) are removed. Orange triangles represent the activity when 4 connections between the regions (nodes) LOC-FuG, LOC-SPC, LOC-ITG, LOC-IPC (21-17, 21-39, 21-19, 21-18) are removed. Magenta stars: links between the regions (nodes) LOC-FuG, LOC-SPC, LOC-ITG, LOC-IPC, LOC-PC (21-17, 21-39, 21-19, 21-18, 21-31) are removed. Turquoise triangles: links between the populations (nodes) LOC-FuG, LOC-SPC, LOC-ITG, LOC-IPC, LOC-PC, LOC-LgG (21-17, 21-39, 21-19, 21-18, 21-31, 21-23) are removed. In the inset is shown an enlargement of the first, positive part of the spectra. Panel (b): Maximal eigenvectors calculated when the original structural matrix is considered as network structure and when successive links are removed. Symbols and the color code are the same as in panel (a). The blue lines represent the most unstable localized nodes to which are associated the most unstable directions. In particular panel (b1) shows the situation where the structural matrix is intact (black circles) and where the first link has been removed (red squares). Removing the link between the populations (nodes) LOC-FuG (21-17) corresponds to the loss of importance of node 17, which is not localized anymore. In panel (b2) are shown the maximal eigenvectors in case 2 removals (green diamonds), 3 removals (blue triangles) and 4 removals (orange triangles) are operated. Every time an additional link is cut according to the Linear Stability Analysis procedure detailed for panel (a), the corresponding node does not appear any more as important (i. e. localized) when calculating the maximal eigenvector. Finally in panel (b3) are shown the maximal eigenvectors in case 5 removals (magenta stars) and 6 removals (turquoise triangles) are operated: when all the relevant lesions are performed there are no more localized nodes (except the EZ), thus suggesting that the unstable directions are not accessible anymore.

