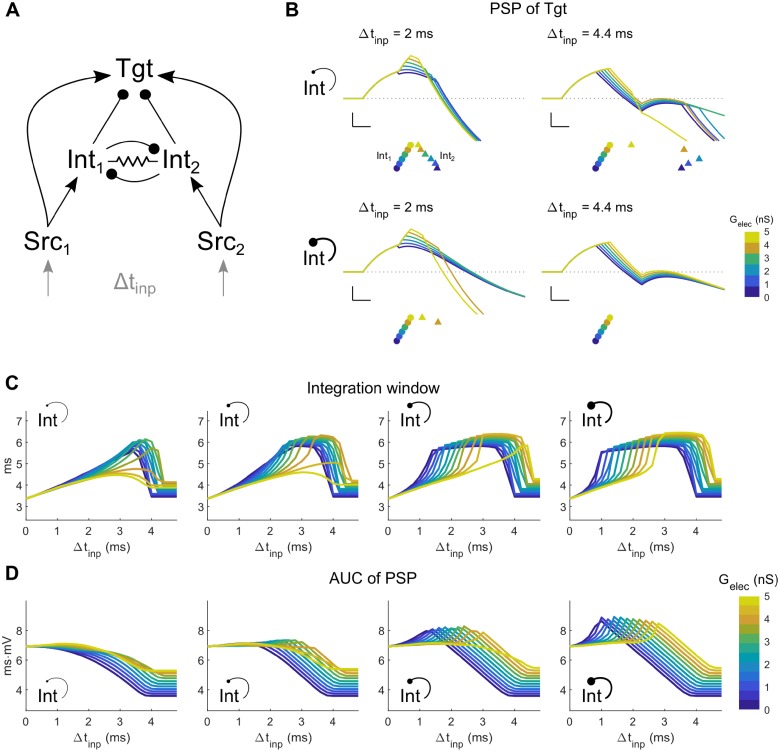
Fig 4. Coupled canonical circuit (CCC) model: Two Src neurons and two Int neurons lead to a common Tgt neuron.
A: Model schematic. For the simulations shown here, the Int neurons were electrically coupled and were reciprocally connected by an inhibitory synapse. Each Src neuron receives its own input, with timing difference between the two inputs Δtinp. B: Examples of Tgt PSP for different electrical synapse strengths between interneurons of the coupled network (colored lines and legends). Each subpanel shows PSPs for different input timing differences Δtinp (left: 2 ms, right: 4.4 ms), and strength of reciprocal inhibition GGABA→Int (top: 1 nS, bottom: 7 nS). Scale bar is 1 mV, 1 ms. Colored symbols represent the spike times of Int1 (circles ●) and Int2 (triangle ▲), with colors representing different values of Gelec between the two interneurons. Symbols are vertically separated for clarity. C-D: Integration window and AUC of the PSP in Tgt for varied strengths of Gelec (0–5 nS) and GGABA→Int (1, 3, 5, 7 nS from left to right).

