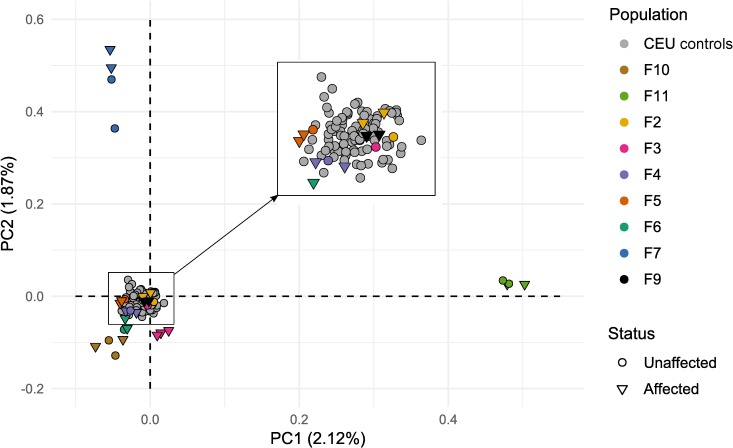
Fig 2. Principal component analysis (PCA) results of samples processed for pVAAST analysis.
The PCA is based on the 30 samples from the discovery set and 98 CEU controls extracted from the 1000 genomes databases. This plot represents the 2 first principal components which respectively account for 2.12% and 1.87% of the genetic variability. The color code represents the population source: each family sequenced by WES has its own color described in the legend, the CEU controls are in grey. The shape of each dot represents the RA status of the represented individual.

