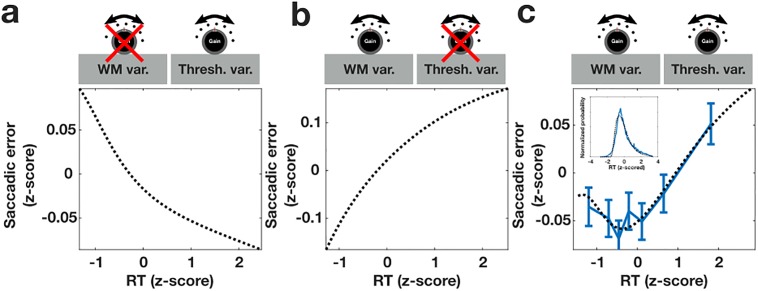
Fig 3. The effect of sources of gain variability on the speed-accuracy relationship.
a) The speed-accuracy curve produced when including trial-to-trial oculomotor response threshold variability, but not gain variability. b) The speed-accuracy curve produced when including WM gain variability, but not threshold variability. c) The speed-accuracy curve resulting from the best fitting model with balanced independent WM and oculomotor threshold variability. Inset depicts the calculated z-scored reaction time distribution compared to the empirical z-scored reaction time distribution across all sessions. Dashed black lines indicates calculated speed-accuracy curves, blue indicates empirical data. All examples include accumulating Gaussian noise variability. For all calculations the size of the WM and oculomotor populations was n = 11 neurons. Sustained WM activity representing the location of the target was modeled as a Gaussian peak of unit magnitude and variance centered on the neuron represent the target location. Neurons represented a region of visual space evenly spanning ±4 standard deviations. The mean amplitude of the WM population was equal to 2 and the mean response threshold was held constant at 200. Regarding the three free model parameters: The standard deviation of the accumulating Gaussian noise, σ = 12.2775; the width of the uniform distributions of response thresholds, τ = 118.0400 and WM gain values, ω = 2.4952. Speed-accuracy curves for a and b were computed by setting ω and τ equal to zero respectively.

