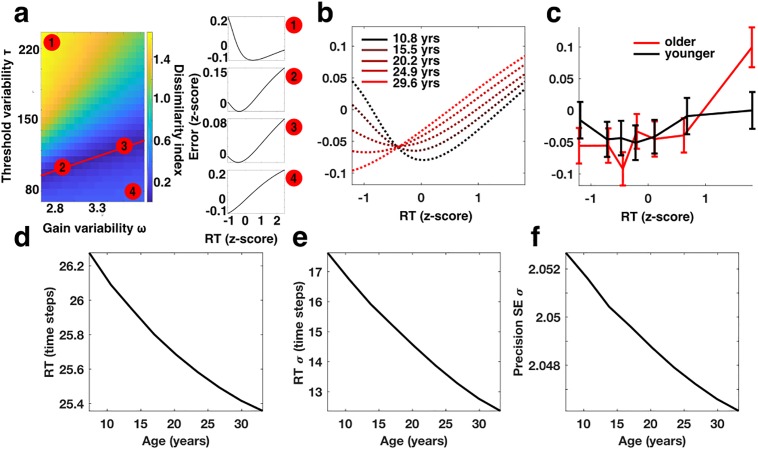
Fig 4. The effect of stabilizing variability during development.
a) The shape of the speed-accuracy relationship changes depending on the balance of WM gain variability (x-axis) and response threshold variability (y-axis). The color depicts the dissimilarity in shape (magnitude of the vector difference) between the speed-accuracy curve determined to fit the behavioral data best (Fig 3c) and the speed-accuracy curve for other values of WM gain and response threshold variability. The red line depicts a region in parameter space in which WM gain and threshold variability produces nearly identical U-shaped speed-accuracy curves similar to that which is observed in the empirical data. Numbered side panels (1–4) are illustrative examples of speed-accuracy curves computed from different regions of the parameter space corresponding to the matched number in the heat plot. b) Best fitting age-dependent speed-accuracy curves estimated from the mechanistic model of MGS performance. c) The empirical speed-accuracy curves (as in Fig 3c) after dividing the data into younger (range: 8.8–20.0 years; mean: 16.3 years; standard deviation: 2.5 years) and older (range: 20.0–32.6 years; mean: 24 years; standard deviation: 3.03 years) age groups defined by a median split. For both b and c, the x-axis corresponds to z-scored RT and the y-axis corresponds to z-scored and rectified SE. The apparent Age*RT interaction is does not reach statistical significance when a traditional linear model is applied. However significant age-related changes in the speed-accuracy relationship are apparent when the behavioral data is fit using the mechanistic model. Expected age-related changes in d) mean RT; e) the standard deviation of RT; and f) the precision (standard deviation of SE) of MGSs estimated from the best fitting parameters of the developmental mechanistic model.

