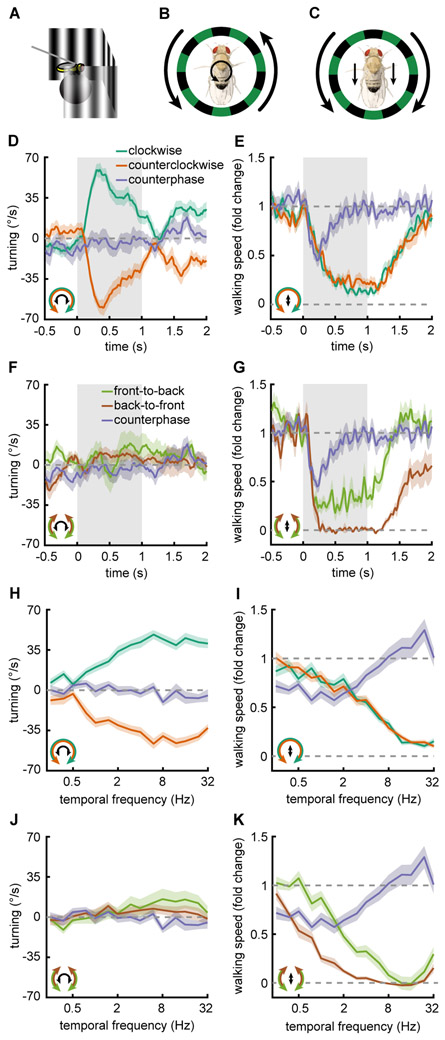
Figure 1. Flies turn and slow in response to visual motion.
Error patches represent standard error of the mean. Icons in the bottom left indicate the stimulus presented (outside) and the behavioral response measured (inside).
(A) Behavioral responses were measured by tethering the fly above an air suspended ball and monitoring the rotation of the ball as visual stimuli were presented on 3 screens surrounding the fly.
(B, C) Diagram of the stimuli and fly behavioral response for (B) rotational and (C) translational motion stimuli.
(D) Fly turning velocity over time in response to clockwise (green, n=69), counterclockwise (orange, n=69), and counterphase (purple, n=19) sine wave gratings. Counterphase gratings are equal to the sum of clockwise and counterclockwise stimuli. Stimulus is presented during gray shaded region.
(E) As in D but measuring the fly’s walking speed.
(F) Fly turning velocity over time in response to front-to-back (FtB, green, n=18), back-to-front (BtF, brown, n=14) and counterphase (purple, n=19) sine wave gratings. Counterphase gratings are equal to the sum of FtB and BtF stimuli. Stimulus is presented during gray shaded region.
(G) Same as in F but measuring the fly’s walking speed.
(H) Mean fly turning to rotational sine wave gratings (green, orange, n=69) and counterphase gratings (purple, n=19) at a variety of temporal frequencies. Data colored as in (D).
(I) Same as in H but measuring the fly’s walking speed.
(J) Mean fly turning to FtB (green, n=18) and BtF (brown, n=14) sine wave gratings and counterphase gratings (purple, n=19) at a variety of temporal frequencies. Data colored as in (E).
(K) Same as in J but measuring the fly’s walking speed.
Throughout, error patches represent standard error of the mean.
See also Figure S1 and Supplemental Movie M1.

