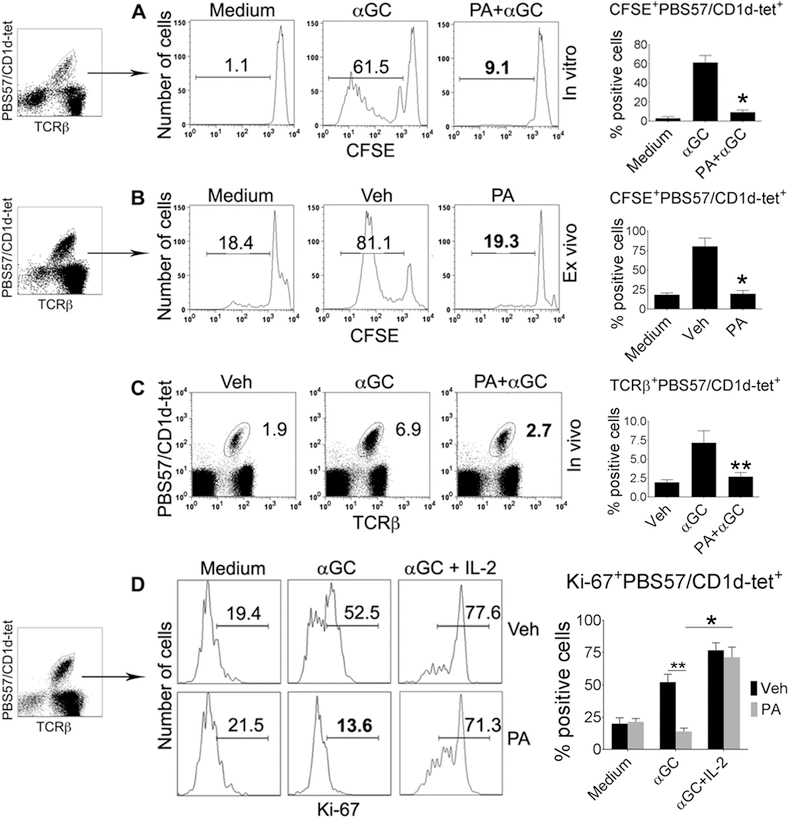
Figure 6. Effect of PA on iNKT cell proliferation.
(A) Spleen cells from B6 mice were labeled with CFSE, and cultured with medium alone, αGalCer (αGC), or PA+αGalCer for 4 d at 37°C. iNKT cell proliferation was assessed by CSFE dilution in PBS57/CD1d-tet+ TCRβ+ live B220– lymphocytes. Numbers on plots indicate % positive cells. The data are representative of five independent experiments, each using spleen cells from one animal. (B) B6 mice were injected with PA or vehicle (Veh), and spleen harvested after 24 h. Spleen cells were labeled with CFSE, cultured with αGalCer for 4 d, and CFSE dilution analyzed on iNKT cells. The data are representative of five independent experiments, each using 3 mice per group. (C) B6 mice were injected with vehicle, αGalCer, or PA+αGalCer. Spleen cells isolated from these animals were analyzed for PBS57/CD1d-tet+ TCRβ+ cells on gated live B220– lymphocytes. The data shown are representative of three independent experiments, each using 3 to 4 mice per group. (D) B6 mice were injected with PA or vehicle, and spleen harvested 12h later. Spleen cells were cultured with medium alone, αGalCer or αGalCer+IL-2 for 4 d, and Ki-67 analyzed on iNKT cells. The data are representative of three independent experiments, each using 3 mice per group. Combined data with statistics are shown in the bar diagrams (*p <0.001, **p<0.01; n = 3–5).

