Figure 3.

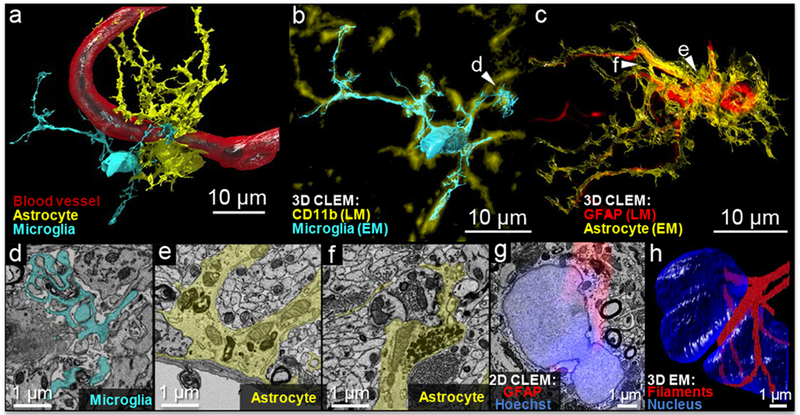
NATIVE-enabled correlative 3D volumetric reconstruction. (a) Volumetric 3D reconstruction based on the segmentation of data from scanning electron microscopy and guided by correlative LM imaging with unambiguous molecular marker identification. (b) and (c) 3D-CLEM overlay of high-resolution EM reconstructed cell contours with fluorescence-based reconstructed molecular markers. The fluorescence and EM reconstructions were displayed in different colors, as indicated by the legends, to show the correlations more clearly. The slight shifts in the fluorescence and EM cell boundaries derive from the different lateral and depth resolution of the light and electron-based datasets and small deformations that were not corrected with the global 3D affine transformation (<2 μm). (d) Phagocytosis by a microglial cell (pseudo-color: cyan) with finger-like protrusions enveloping debris. (e) A cross-section of blood-brain-barrier with the astrocyte (pseudo-color: yellow) around the blood endothelium cells. (f) A tripartite synapse formed by an astrocyte (pseudo-color: yellow) around a pair of pre/post synapses. (g) In 2D-CLEM, fluorescence layer reveals a continuous distribution of the fibrillary protein around the nucleus; (f) 3D-EM reconstruction confirms belt-like GFAP filaments around the astrocyte’s dumbbell-shaped nucleus.
