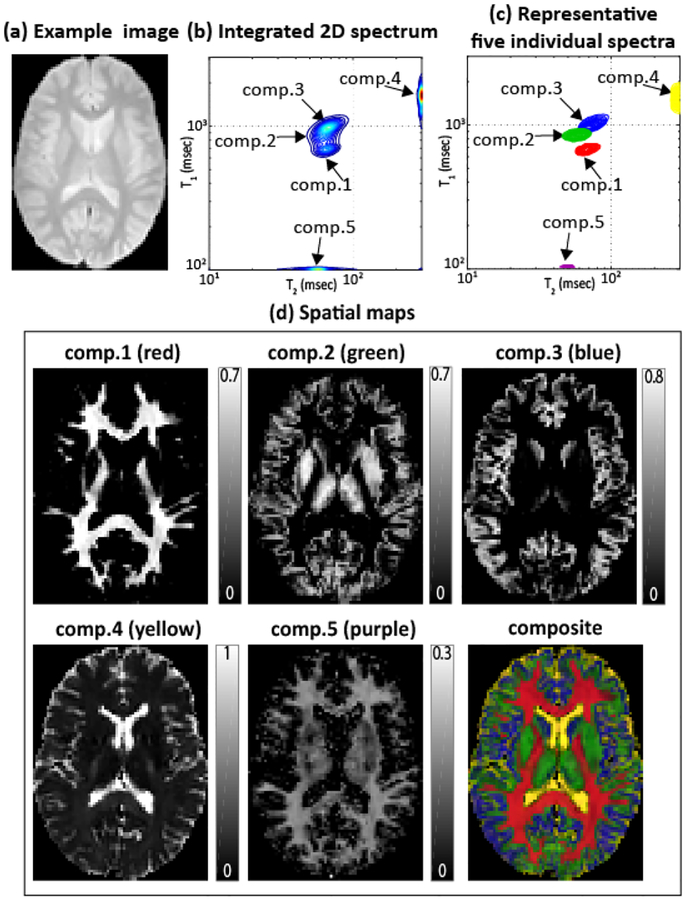
Fig. 3:
RR-CSI of the human brain. (a): An example image from the full data set (TI=0 ms, TE=22.5 ms). (b): The average 2D RR-CSI spectrum (integrated over all voxels). (c): Five representative individual spectra plotted from different spatial locations. (d): Spatial maps (represented as fractions so that they add to one) of the five peaks, along with the color-coded composite image (red: comp.1, green: comp.2, blue: comp.3, yellow: comp.4, and purple: comp.5).

