
Figure 1:
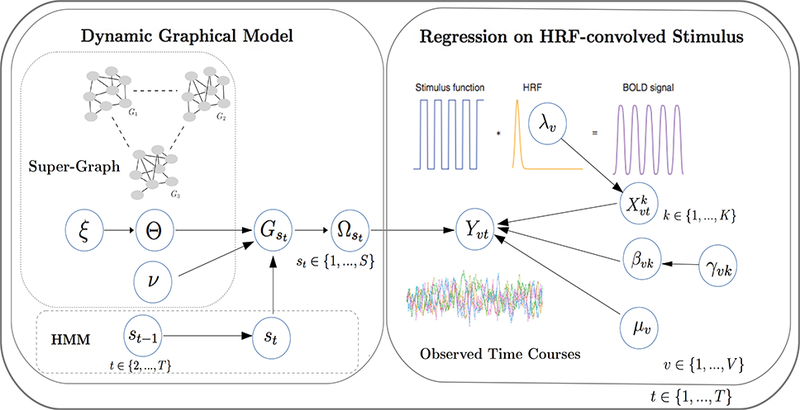
Schematic representation of the proposed Bayesian model for dynamic functional connectivity. A regression model describes the observed BOLD response to a number of different stimuli, via convolution with a HRF. The noise term, capturing spontaneous brain activity, is drawn from a Gaussian graphical model indexed via a HMM, to allow the connectivity structure to change over time. A “super-graph” links the graphs. This results in a marginal multivariate Normal distribution on Yt, with the regression component as the mean and the Gaussian graphical model imposed on the variance-covariance term.