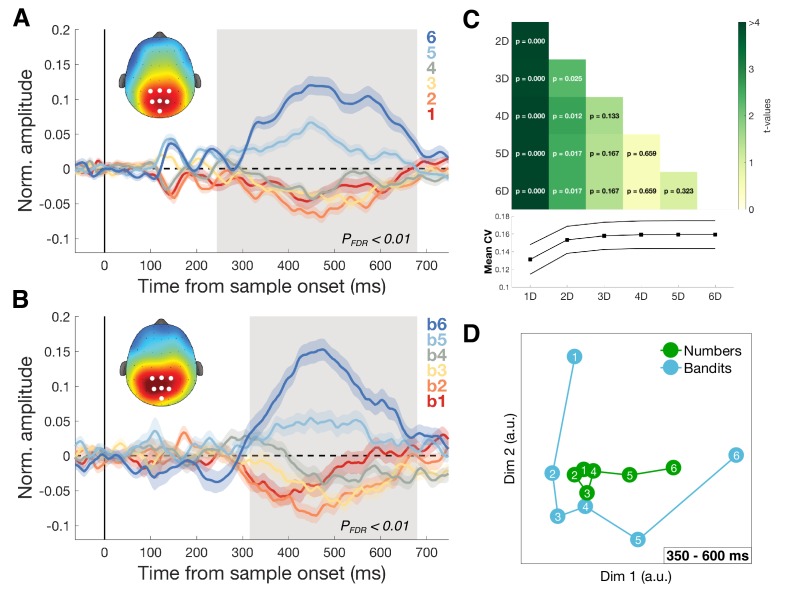
Figure 5. Dimensionality of magnitude representation.
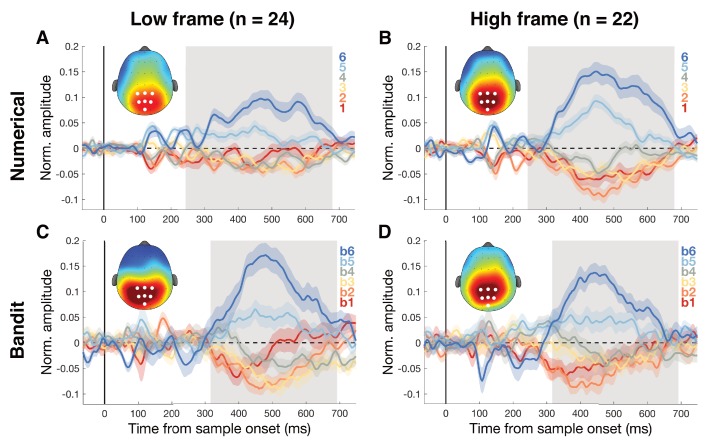
(A) Average normalized amplitudes associated with numbers 1–6, independent of task framing (report highest/lowest) or category (blue/orange) at highlighted centro-parietal electrodes. Grey shaded area shows time of greatest disparity between signals (Kruskal-Wallis, PFDR <0.01). Scalp map inset shows response amplitude for number six during identified time window. Colored shading represents SEM. The ascending direction of the univariate responses was independent of task framing (Figure 5—figure supplement 1) (B) Equivalent analysis for bandits b1 (lowest value) to b6 (highest value) in the bandit task. Scalp map shows response amplitude for highest subjectively valued bandit b6. (C) Dimensionality of the data was iteratively reduced using SVD and the strength of cross-validation under each new dimensionality was assessed by comparing the mean cross-validation in the 350–600 ms time window (bottom plot). Each cell in the grid contains the t- and p-value of a pairwise comparison of mean CV under different dimensionalities of the data. Reduction to one (and to a lesser degree two) dimension(s) significantly reduced the size of the effect. (D) Multidimensional scaling (MDS) revealed two principal axes that describe the data: a magnitude axis approximately following the number/bandit order and a certainty axis distinguishing inlying (e.g. 3,4) from outlying (e.g. 1,6) numbers or bandits.


