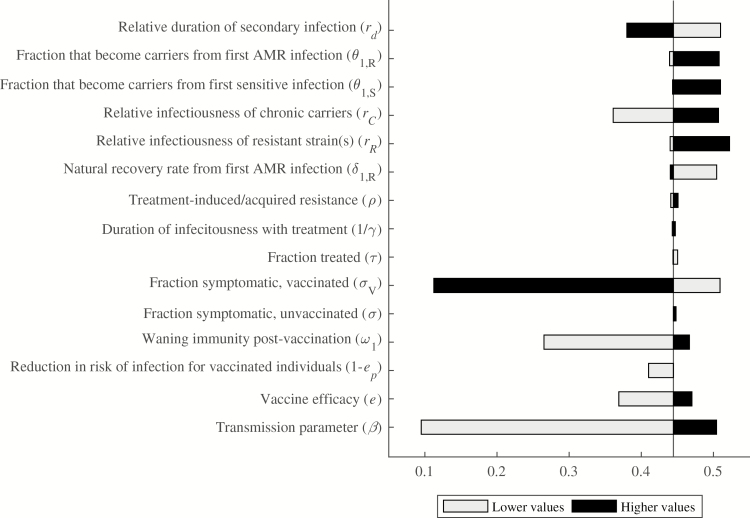
Figure 4.
One-way sensitivity analyses for the proportion of cases averted by vaccination. Parameter values were varied individually to assess their impact on the proportion of total cases averted in the 10 years following vaccine introduction. The comparator proportion of cases averted was .44, using the base-case parameter values. Black bars represent higher parameter values, whereas gray bars represent lower parameter values. The horizontal axis shows the proportion of cases averted, with possible values ranging from 0 to 1. Abbreviation: AMR, antimicrobial-resistant.

