
Figure 5. RNA-Seq Analysis Reveals Genes and Pathways Targeted by KLF4.
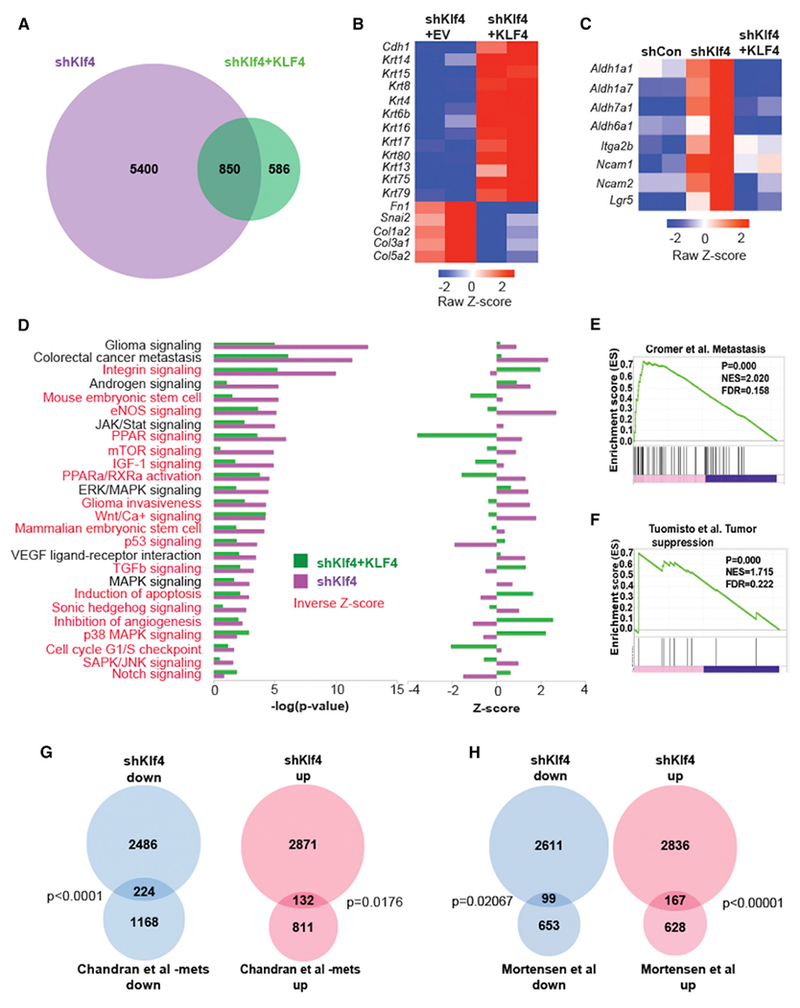
(A) Venn diagram of differentially expressed genes (FDR <0.01, FC >2) in the Akt-transformed cell line after Klf4 knockdown (shKlf4) versus KLF4 re-expression (shKlf4 + KLF4).
(B) Heatmap of EMT genes regulated by decreased (shKlf4 + empty vector [EV]) or increased KLF expression (shKlf4 + KLF4).
(C) Heatmap of stem cell genes regulated by Klf4 knockdown (shKlf4) and KLF4 re-expression.
(D) Ingenuity pathway analysis (canonical pathway) reveals pathways regulated by decreased (shKlf4) or increased (shKlf4 + KLF4) KLF4. Left: −log(p value), right: Z score. Pathways highlighted in red represent those that are inversely regulated by knockdown and re-expression of Klf4 (inverse Z score).
(E) GSEA reveals positive enrichment of genes in a tumor metastasis gene signature after decreased (shKlf4) Klf4 expression.
(F) GSEA reveals positive enrichment of genes in a tumor suppressor gene signature after increased (shKlf4 + KLF4) KLF4 expression.
(G) Overlap of genes after Klf4 knockdown in the Akt-transformed cell line with those expressed in a cohort of human metastatic prostate cancer.
(H) Overlap of genes after Klf4 knockdown in the Akt-transformed cell line with those expressed in a cohort of aggressive human prostate cancer.