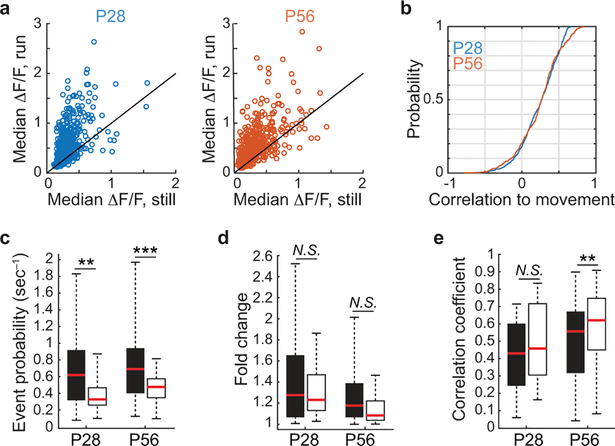
Extended Data Fig. 7 |. P28 and P56 modulation of PYR cell somas and dendrites during spontaneous activity.
a, Plot of each cell’s visually-evoked median ΔF/F as a function of behavioral state, for all recorded cells, at P28 and P56, in the absence of visual stimulation, measured at the soma (P28, n = 563 cells, still to run, P = 4.31E-60; P56, n = 723 cells, P = 1.94E-89, Wilcoxon sign rank test). b, Plot of cumulative distributions of the correlation coefficients of GCaMP6f signals to running for all recorded pyramidal neurons while viewing a gray screen. (P28: n = 860 cells; P56: n = 513 cells; P = 0.993, Mann-Whitney U test). c, Boxplots of temporally deconvolved event probabilities of dendrites during gray screen viewing at P28 and P58 during in running and still conditions. (P28, n = 36 branches; still to run, P = 0.0044; P56, n = 96 branches, still to run, P = 4.36E-06, Wilcoxon sign rank test). d, Boxplots of the fold change between sister branches as a function of age and behavioral state (P28, n = 18 branch pairs, P = 0.987; P56, n = 56 branch pairs, still to run, P = 0.02, Wilcoxon sign rank test). e, Boxplots of the correlation coefficients between event probability time series of sister branches as a function of age and behavioral state (P28, n = 18 branch pairs, P = 0.2914; P56, n = 56 branch pairs, still to run, P = 0.0042, Wilcoxon sign rank test). **P<0.01, ***P<0.001, N.S. = Not significant. Boxplot parameters as in Fig. 1.

