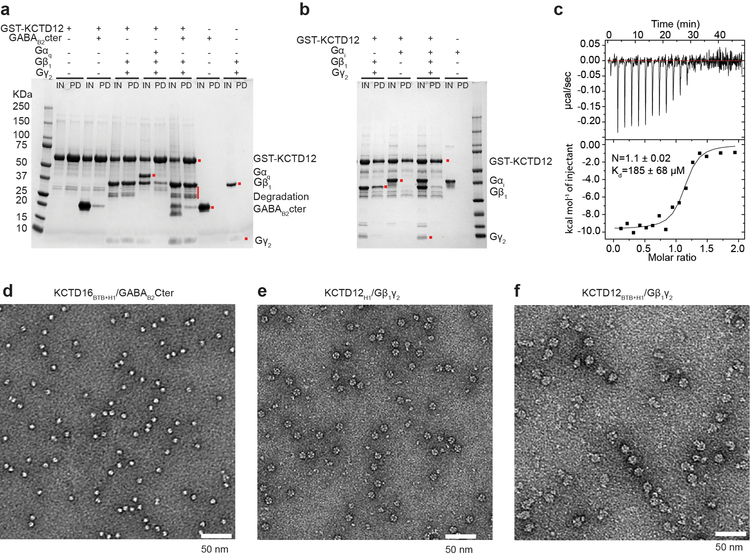
Extended Data Figure 3 |. Representative negative stain electron micrographs.
a, The full SDS-PAGE gel of pulldown experiment shown in Figure 2a. b, Gαi competes with KCTD12 for binding Gβ1γ2. Pull-down experiments were carried out in the same way as Figure 2a except that Gαi subtype instead of Gαq was used. c, Isothermal titration calorimetry affinity measurement for KCTD12H1 binding to Gβ1γ2. d, Representative image of KCTD16BTB+H1/GABAB2Cter. e, Representative image of KCTD12H1/Gβ1γ2. f, Representative image of KCTD12BTB+H1/ GABAB2Cter/Gβ1γ2.

