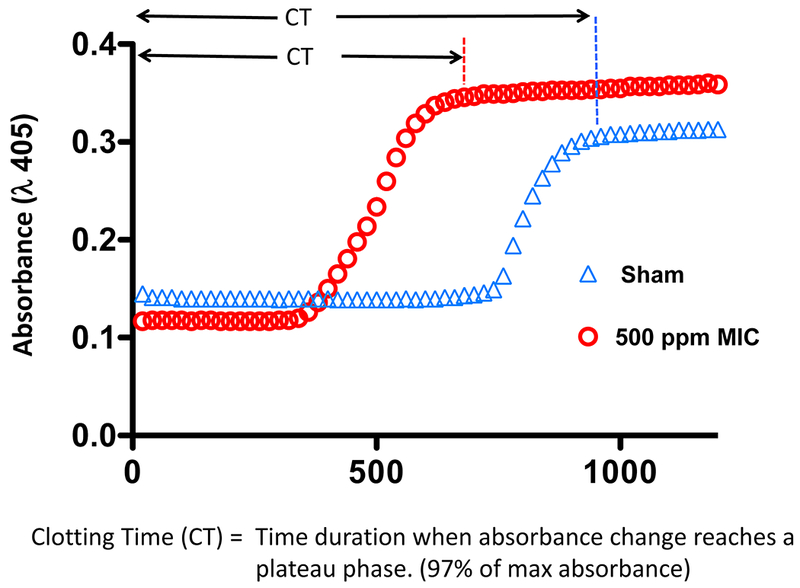
Figure 3.

Effect of MIC inhalation on clotting time of rat plasma. Clotting time was assessed in 96-well format by recalcification of platelet-poor plasma and spectrophotometric measurement of the time-dependent absorbance increase that occurs due to clot formation. Two representative plasma clotting curves are presented: One was obtained from a plasma sample obtained after sham exposure (blue triangles; 0 ppm) and a second curve was from plasma obtained after MIC exposure (red circles; 500 ppm). Absorbance values eventually reached a plateau phase, at which time samples have attained a semisolid clotted state that is visible without magnification. The clotting time (CT) of the reaction was defined as the time to reach this plateau in absorbance (97% of the absorbance maximum).
