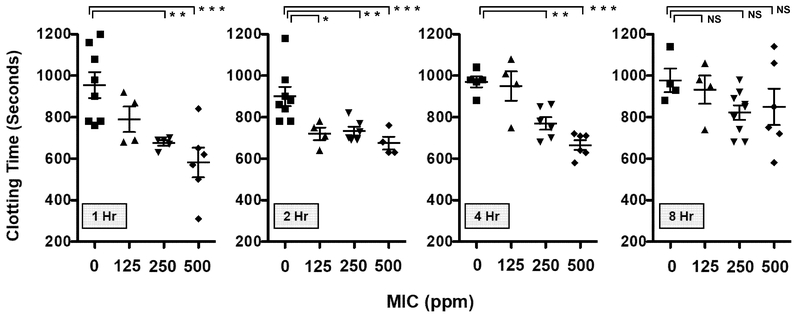
Figure 4.
Effect of MIC inhalation exposure concentration (0–500 ppm, 30 min) on clotting time. Plasma clotting time was measured at 1, 2, 4 and 8 hr after sham exposure (0 ppm) or MIC inhalation (125, 250, 500 ppm). Reactions were initiated by addition of CaCl2, with spectrophotometric measurement of time-dependent absorbance increases. Each plotted symbol represents the mean clotting time in seconds of three replicates ± SEM for an individual rat subject. *P < 0.05 and denotes a significant difference for MIC-exposed versus sham-exposed (0 ppm) plasma samples. NS indicates that there was no difference between sham- and MIC-exposed groups at 8 hr (n = 4–8 per group).

