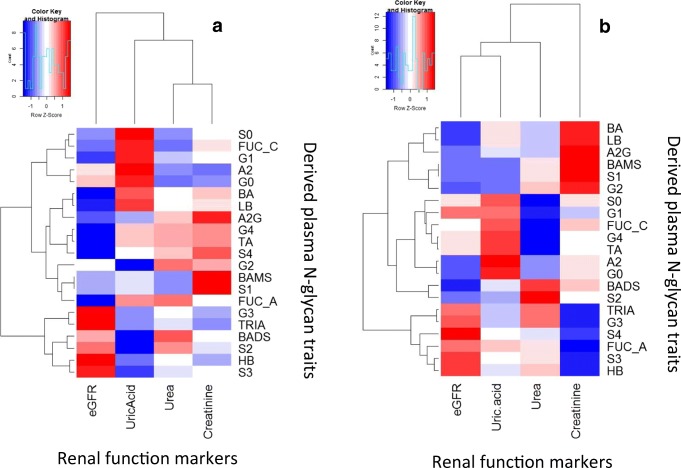
Fig. 2. Correlation between derived plasma N-glycan traits with or without CKD. (a) No CKD (b) CKD-T2DM.
LB (rs = 0.21, p = 0.008), BA (rs = 0.22, p = 0.005), A2G (rs = 0.18, p = 0.025), S1 (rs = 0.19, p = 0.017), and BAMS (rs = 0.19, p = 0.017) were positively correlated with creatinine among T2DM without CKD. However, S3 (rs = −0.19, p = 0.013), G3 (rs = −0.23, p = 0.004), FUC_A (rs = −0.19, p = 0.014) and TRIA (rs = −0.23, p = 0.003) were negatively associated with creatinine. There were no statistically significant correlations between N-glycans and urea and uric acid in this group. On the other hand, TRIA was negatively associated with creatinine among T2DM with CKD. S0 (rs = 0.26, p = 0.023), G1 (rs = 0.27, p = 0.021) and FUC_C (rs = 0.30, p = 0.035) were positively associated with uric acid whereas S2 (rs = −0.30, p = 0.011), G3 (rs = −0.25, p = 0.036), BADS (rs = −0.26, p = 0.028), TRIA (rs = −0.025, p = 0.029) were negatively associated with uric acid in this group.

