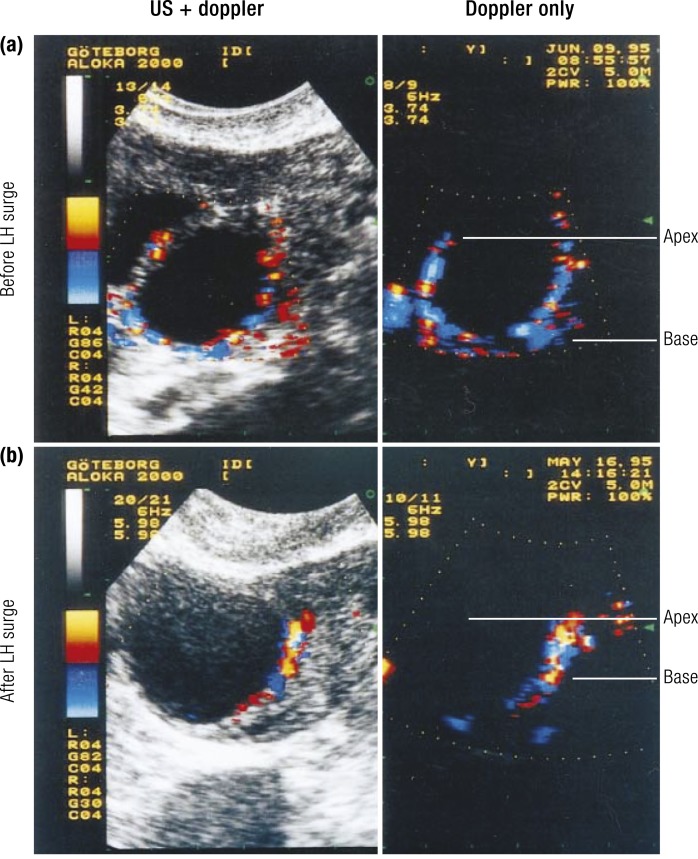
Figure 10.
Blood flow in the human preovulatory follicle. (a and b) Color Doppler and ultrasound (US) images of human ovarian follicles (a) before the LH surge and (b) after the LH surge but before ovulation. For each panel, the left side shows ultrasound with Doppler blood velocity (US + Doppler) and right side shows only Doppler blood velocity. Red represents flow toward the transducer. Blue represents flow away from the transducer. Blood flow is concentrated at the follicle base and is less prominent at the follicle apex as ovulation approaches (b). [Reproduced with permission from Brannstrom M, Zackrisson U, Hagstrom HG, et al. Preovulatory changes of blood flow in different regions of the human follicle. Fertil Steril 1998;69(3):435–442.]

