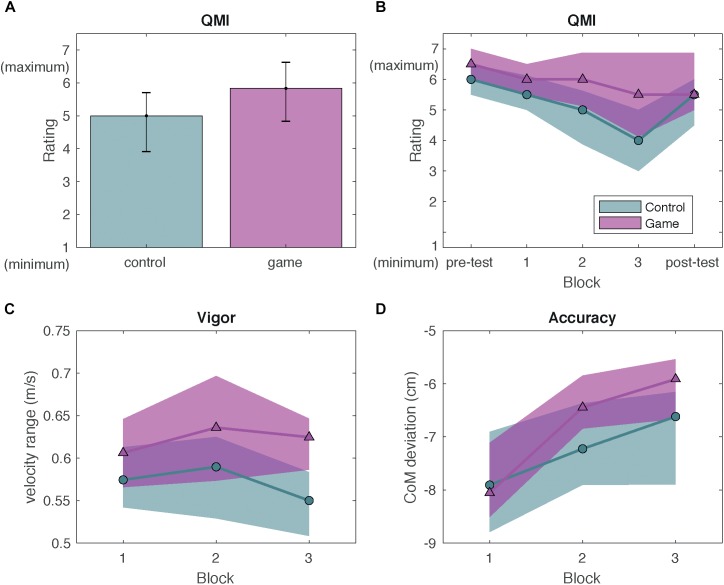
FIGURE 4.
Results Experiment 2. Green circles represent data from the control group and pink triangles represent data from the game group. Shaded areas indicate the interquartile range. (A) Median QMI for the game and control group. Error bars represent the interquartile range. (B) Median QMI with interquartile range as a function of block. (C) Median movement vigor with interquartile range as a function of block. (D) Median movement accuracy with interquartile range as a function of block.

