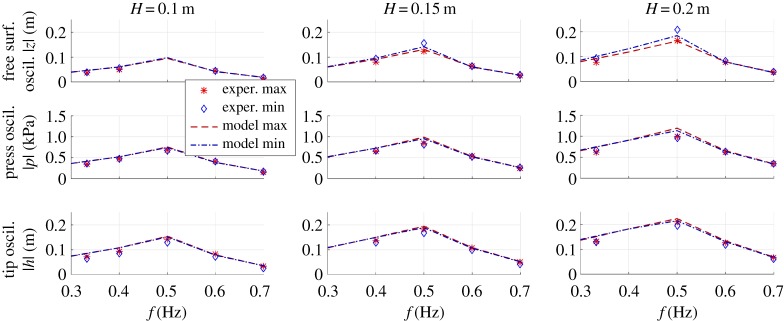
Figure 10.
Comparison of experimental and model steady-state oscillation amplitudes (maxima and minima, in magnitude) of relevant physical variables (z, p, h) at different wave frequencies and heights. Data refer to tests with electrical activation. Markers indicate the experimental points, lines indicate the model points. (Online version in colour.)

