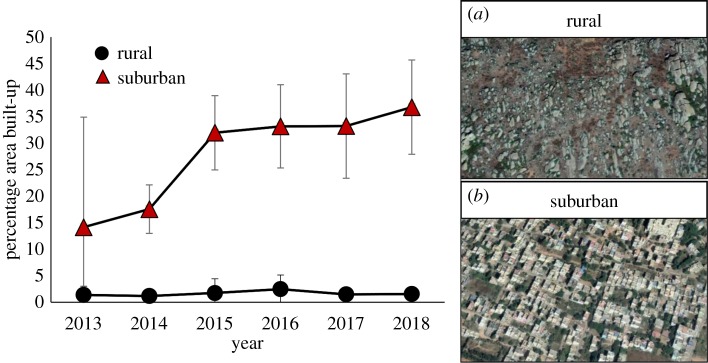
Figure 1.
Percentage of area built-up by anthropogenic development in rural and suburban study sites across years. Shown are means ± 95% CI from replicate sites (N = 3 each in rural and suburban). Representative satellite images of rural and suburban areas (2018) are shown in (a,b), respectively. (Online version in colour.)

