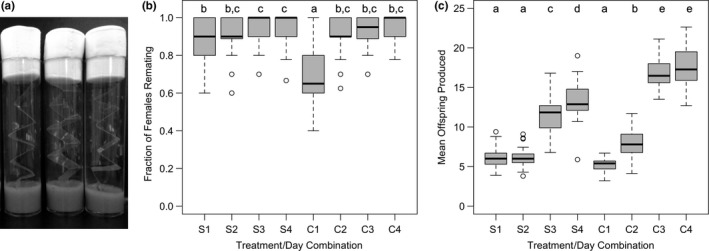
Figure 1.

(a) Standard Drosophila culture vials used in this assay each containing 10 male and female 10 flies, agar/banana/killed‐yeast media and the accordion‐style acetate inserts used in our experimental treatments to increase environmental spatial complexity. (b and c) Boxplots illustrating (b) the fraction of female Drosophila melanogaster in a vial that remated and (c) their mean offspring production in either simple (S) or environmentally complex (C) chambers,measured on each of the 4 days of the assay. The boxes enclose the middle 50% of data (interquartile range, IQR), with the location of the median represented by a horizontal line. Values >±1.5 × the IQR outside the box are considered outliers and depicted as open circles. Whiskers extend to the largest and smallest values that are not outliers. Boxplots that are not sharing a letter have significantly different means
